Tag: Data analytics
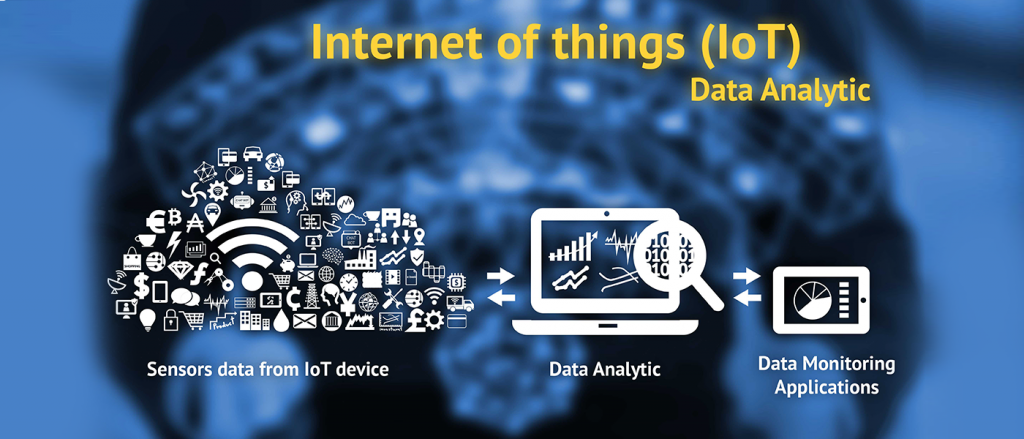
IoT and data remain intrinsically linked together. Data consumed and produced keeps growing at an ever expanding rate. This influx of data is fueling widespread IoT adoption as there will be nearly 30.73 billion IoT connected devices by 2020. The Internet of Things (IoT) is an interconnection of several devices, networks, technologies, and human resources to achieve a common goal. There are a variety of IoT-based applications being used in different sectors and have succeeded in providing huge benefits to the users.
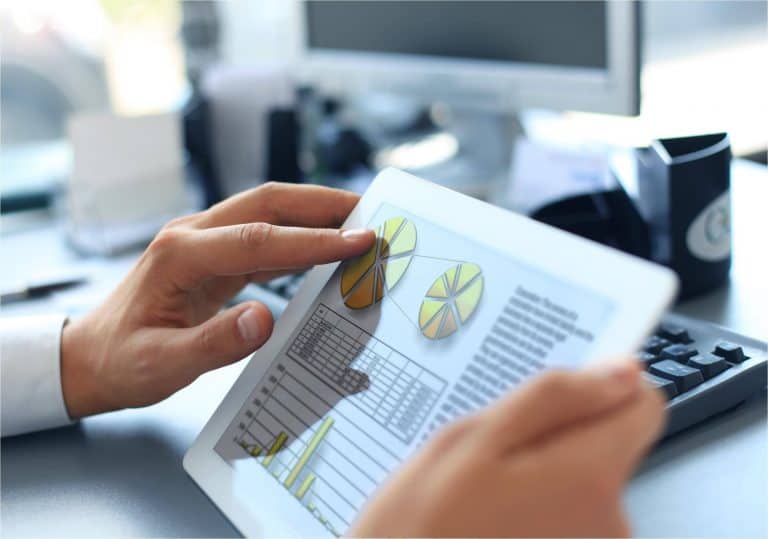
The data generated from IoT devices turns out to be of value only if it gets subjected to analysis, which brings data analytics into the picture. Data Analytics (DA) is defined as a process, which is used to examine big and small data sets with varying data properties to extract meaningful conclusions and actionable insights. These conclusions are usually in the form of trends, patterns, and statistics that aid business organizations in proactively engaging with data to implement effective decision-making processes.

Merging Data Analytics and IoT will Positively Impact Businesses
Data Analytics has a significant role to play in the growth and success of IoT applications and investments. Analytics tools will allow the business units to make effective use of their datasets as explained in the points listed below.
- Volume: There are huge clusters of data sets that IoT applications make use of. The business organizations need to manage these large volumes of data and need to analyze the same for extracting relevant patterns. These datasets along with real-time data can be analyzed easily and efficiently with data analytics software.
- Structure: IoT applications involve data sets that may have a varied structure as unstructured, semi-structured and structured data sets. There may also be a significant difference in the data formats and types. Data analytics will allow the business executive to analyze all of these varying sets of data using automated tools and software.
- Driving Revenue: The use of data analytics in IoT investments will allow the business units to gain an insight into customer preferences and choices. This would lead to the development of services and offers as per the customer demands and expectations. This, in turn, will improve the revenues and profits earned by the organizations.

- Competitive Edge: IoT is a buzzword in the current era of technology and there are numerous IoT application developers and providers present in the market. The use of data analytics in IoT investments will provide a business unit to offer better services and will, therefore, provide the ability to gain a competitive edge in the market.
There are different types of data analytics that can be used and applied in the IoT investments to gain advantages. Some of these types have been listed and described below.
- Streaming Analytics: This form of data analytics is also referred as event stream processing and it analyzes huge in-motion data sets. Real-time data streams are analyzed in this process to detect urgent situations and immediate actions. IoT applications based on financial transactions, air fleet tracking, traffic analysis etc. can benefit from this method.
- Spatial Analytics: This is the data analytics method that is used to analyze geographic patterns to determine the spatial relationship between the physical objects. Location-based IoT applications, such as smart parking applications can benefit from this form of data analytics.
- Time Series Analytics: As the name suggests, this form of data analytics is based upon the time-based data which is analyzed to reveal associated trends and patterns. IoT applications, such as weather forecasting applications and health monitoring systems can benefit from this form of data analytics method.
- Prescriptive Analysis: This form of data analytics is the combination of descriptive and predictive analysis. It is applied to understand the best steps of action that can be taken in a particular situation. Commercial IoT applications can make use of this form of data analytics to gain better conclusions.

There have been scenarios wherein IoT investments have immensely benefitted from the application and the use of data analytics. With the change and advancement in technology, there are emerging areas in which data analytics can be applied in association with IoT. For instance, actionable marketing can be carried out by applying data analytics to the product usage. IoT analytics will also allow the increased safety and surveillance abilities through video sensors and application of data analytics methods.
Healthcare is one of the prime sectors of every country and the utilization of data analytics in IoT based healthcare applications can provide breakthroughs in this area. The reduction of the healthcare costs, enhancement of telehealth monitoring, and remote health services, increased diagnosis and treatment can be achieved using the same.
The utilization of data analytics shall, therefore, be promoted in the area of IoT to gain improved revenues, competitive gain, and customer engagement. By collaborating with the right strategy partner, businesses can couple data analytics with IoT to leverage data for gaining a competitive advantage.
Monetize IoT Data with Analytics [ Source : TEDx Talks]

Improving the customer experience is the mantra for survival in today’s highly competitive business environment. More and more businesses have identified machine learning as a reliable tool towards this end.
Machine learning is in essence software coded differently to traditional software. Rather than a long list of if-then-else statements typical of traditional software, machine learning predicts what humans would do given a specific set of inputs.
Currently, marketers and others leverage machine learning to further customer experience through improved personalization, enhancing the computer vision, improving natural language, greater decision support, through analytics optimization, and augmented analytics.
1. Machine Learning Aids Personalisation
Today’s highly pampered customers prefer and even demand personalized engagement and experiences. Machine Learning facilitates it to the hilt. Data and analytics allow marketers to understand customer preferences. Using machine learning in combination with new data sources from the Internet of Things (IoT,) telematics, geolocation beacons, and social data improve the insights.
Several marketers now apply machine learning based algorithms to understand the nuances of their customer’s preferences and engage them on their terms. Marketers use such algorithms to develop highly relevant marketing campaigns, such as a matching audience profile with highly targeted video content. These steps improve the call-to-action.
Customers receive tailored offers rather than irrelevant non-contextual offers. Such non-contextualized offers have a very low probability of conversion.
Segmentation gets better. For instance, insurance companies do not have to go by general assumptions or time-honored conventions to offer the highest automobile insurance premiums to a 16-to-25-year-old male. They can factor in everything specifically related to the customer, and tailor the premium based on individual rather than class factors.
The creation of such relevant content is the godsend at a time when over 90% of online users in the U.S. and Europe feels advertising is more intrusive today compared to two years ago.
Related Infographic: Machine Learning- Deciphering the most Disruptive Innovation
2. Machine Learning Facilitates Computer Vision
Machine Learning technology detects everything and anything, from objects and people to complex scenes within the images and videos. Applying the technology to enhance the quality of digital assets is a sure-shot way to win the customer’s heart.
One big success story is Twitter’s Magic Pony, which leverages machine learning technology to make pixelated images sharper, and enhances the quality of video captured on mobile phones in poor lighting conditions. Apart from delighting the customer, the spin-off benefit of Twitter is lower data usage, and by extension improved streaming abilities.

3. Machine Learning Aids Natural Language Processing
The next big thing revolutionizing human interactions with computers is speech recognition technology. The ability of computers to recognize human speech and act on it not only spares the hassles of keyboard typing but also unlocks a host of new possibilities. While speech recognition technology has been around for a while, the application of advanced machine learning technologies has made the system highly accurate, with error rates far lower than humans. Google’s Cloud Speech API now recognizes over 80 languages and variants, with a high level of accuracy.
Marketers can, and are leveraging advanced linguistic data and cognitive technologies spawned by speech recognition capabilities to create highly engaging content, targeted at the customer. In a sense, it furthers the cause of personalization in a big way.
Marketers benefit from natural language capabilities in myriad other ways also. A case in point is the intuitive new tool launched by Relative Insight, a UK based start-up. The tool converts natural language into data, offering marketers a wealth of information to connect with specific audiences instantly and deeply.
4. Machine Learning Improves Decision Support
Machine learning allows the marketers to predict the future. The “machine” becomes capable enough to predict the customer’s likely course of action, based on the data at his disposal, and his present behavior. The market is now flooded with several digital tools and services which provide advanced recommendations on this front.
On the anvil is “copyless paste,” where machine learning will save users time by proactively offering to share information between apps. Marketers will leverage the concept further to offer proactive product suggestions. Integration with other systems also offers the scope for proactive and automatic delivery.

5. Machine Learning Facilitates Analytical Optimization
Businesses leverage the immense analytics opportunities offered by machine data to fine-tune their operations, deliver new business models, and offer new products and services in tune with customer demand. The insights gained, predict not just how a customer may behave or act, but also how the competition may move in the future.
One sector where machine learning algorithms are already in widespread use is the financial sector. Financial services companies use various machine learning algorithms such as random forest and gradient boosted models for a host of applications, from predicting the probability of being ranked at the top of aggregator portals to predict midterm cancellation rates on policies, and more. These applications have a direct bearing on customer satisfaction. For example, banks and financial institutions predict volumes for credit card lines, to adjust rates and terms, and thereby attract the right type and volume of customers for the specific product.
Related Reading: Top Artificial Intelligence Trends to Watch Out for In 2019
6. Machine Learning Facilitates Augmented Analytics
The scope of machine learning improves with the development of technology. Neural networks support better classification and forecasting, decision trees support more complex rule and relationship-based customer experience programs. All these improve the organization’s ability to support complex decisions, forecasts, and optimizations.
Augmented analytics, which co-opts these latest and emerging technologies, combines various elements of the ecosystem, such as data preparation, business intelligence, predictive analytics and machine learning capabilities into a single, automatic and seamless process. Enterprises would be able to cleanse their data easily, to uncover latent insights and patterns.
Today’s huge data create millions of variable combinations impossible to process manually or even with traditional tools. Augmented analytics, powered by machine learning, deliver quicker insights, reducing customer frustration.
What exists now is just the tip of the iceberg. The future holds a world of possibilities. A case in point is the fragmented nature of the machine learning ecosystem being all set for a big churn. Increased competition, the hyper-fast paced changes in technology, and the proliferation of big data at an alarming frequency force many open source machine learning libraries, algorithms and frameworks to join forces and deliver a better deal to their customers. The lower-level personalization commonplace today will make way for a more robust collaborative filtering, delivering a much higher degree of personalization and contextualization than present levels.
Side-by-side, the machine learning ecosystem is becoming increasingly easier to use, and more affordable. Hitherto, only enterprises with large analytics teams could really afford to play around with machine learning. The advent of various solutions delivered in a cloud-based subscription model makes the power of machine learning available to the masses, including start-ups, freelancers, and even individuals.
Marketers and brands can leverage the improved ecosystem to generate a better picture of their customers’ true context, and serve them better. Simply put, customers will get better food, movie, music, travel, product and purchase recommendations.
Related Reading: AI To Solve Today’s Retail Profit Problems

If your company is dealing with Big Data, Data analytics and visualization is a must-have tool to understand and gain insights effectively. There are several tools available in this sector that promise to convert raw data and produce it as solutions that are easily understandable. These solutions can be in the form of charts, videos, infographics or even highly engaging and intuitive presentation that uses Virtual Reality and Augmented Reality (VR & AR). Here are the top 7 data analytics and visualization tools that you can hire to get the most out of your data.
1. Tableau
Tableau is one of the most widely used data visualization software due to its user-friendly, intuitive design, and excellent official supporting documentation. This data analytics and visualization tool are available in five different versions – Desktop, Server, Online, Mobile, and free-to-use Tableau Public. It has the capacity to produce interactive visualizations that are compatible with huge and very fast-changing data sets used in Big Data operations involving artificial intelligence and machine learning applications. It is designed to work great with almost all advanced database solutions such as Hadoop, Amazon AWS, My SQL, SAP, and Teradata.
2. Sisense
This tool is smartly designed to provide a full stack analytics platform with ease of use. The interface offers users a chance to simply drag and drop charts and more complex graphics for achieving interactive visualizations without much of a hassle. The tool has the capability to gather data from multiple sources and query them instantaneously along with an option to share the dashboard across organizations. Sisense is a powerful tool for people who are experienced in this field and can be a little overwhelming for newcomers.
3. Plotly
Plotly is a web-based data visualization platform that lets the user create simple to complex charts directly inside their web browser. It offers a clean, intuitive and fully-featured interface for free, but its commercial package provides more user-friendliness and support. Its ability to enable more complex and sophisticated visualization is a direct result of integration with analytics related programming languages such as R, Python, and Matlab.
4. FusionCharts
This Javascript-based data analytics and visualization tool has the ability to produce 90 different chart types and integrates a large number of platforms and frameworks to offer optimum flexibility. It is one of the leaders in the paid-for market simply because it offers many live templates where users can simply plug in their data instead of starting one from scratch.
5. Google Charts
Google is at the forefront of technology and it stays the course by providing an entire set of data visualization tools that support various data formats including geolocation and offers a variety of outputs. But keep in mind that Google Charts are for people who have worked with data before and can code in JavaScript to make the best use of this amazing tool.
6. QlikView
QlikView tool is a major vendor that competes for supremacy with Tableau since it also provides a wide feature range and high customization setup. It does take time to get used to it, but can be very powerful when used to its full potential. There are numerous third-party resources available online for this clean and clutter-free tool. It additionally offers powerful business intelligence, analytics, and enterprise reporting.
7. Datawrapper
Datawrapper is the perfect tool for media organizations that are looking for creating simple charts to present statistics. It’s simple and clean interface allows easy CSV data upload, to create simple charts and maps that can be quickly embedded into reports.
Data analytics and visualization tools are abundantly available and seeking the best one for your organization can be difficult. It is better to seek the expertise of consultants such as our organization to get the most out of your Big Data.

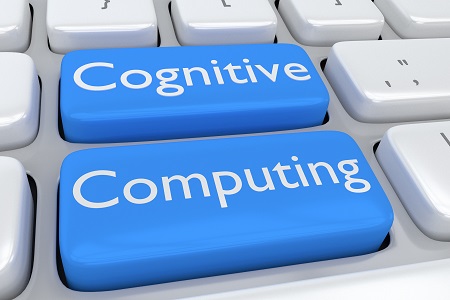
Cognitive computing in a broad sense refers to software mimicking the functioning of the human brain, to make better decisions.
Computers have caught on ever since its inception, owing to its ability to undertake lightning-fast calculations, much beyond the range of human capabilities. However, computing devices face a serious limitation in not being able to accomplish tasks humans take for granted, such as understanding the natural language or recognizing unique objects in an image. While artificial intelligence offers a start in this direction, cognitive computing represents the coming of age in this front.
Cognitive computing, in a sense, represents the third era of computing, with computers that could tabulate sums the in-thing in the 1900s, to programmable systems in the 1950s, and now cognitive systems.
Personal digital assistants such as Siri, already present in smartphones come close to cognitive computing but are not true cognitive systems. Such systems can only respond to a preset number of requests, whereas true cognitive applications give a thoughtful response, without being restrained to a preprogrammed response set.
How Do Cognitive Applications Work?
Cognitive computing aims to simulate human thought processes in a computerized model. To this end, cognitive applications use deep learning algorithms and neural networks and leverage the latest technological solutions such as data mining, natural language processing, and pattern recognition.
Cognitive applications draw on multiple sources of information, including structured and unstructured digital information, sensory inputs such as visual, gestural, auditory, information, sensor-provided information, and more. It then processes the gathered information by comparing it to the set of data it already knows. As such, the more data the system encounters, the more it learns, and the more accurate the system becomes, over time.
Cognitive computing applications integrate data analysis with adaptive page displays (AUI) to tailor content for the specific audience and specific situations.

IBM Watson, one of the earliest approaches to cognitive computing, offered a path-breaking combination of natural language processing, machine learning, and knowledge representation. Watson ingests questions or inputs in natural language mode, search its repository for information, develops and analyze hypotheses on its own, and generates answers, also in natural language mode. What made Watson successful was not just the combination of the multiple capabilities, but the seamless and powerful integration of such different capabilities in a way it influences each other.
Basic Characteristics of Cognitive Applications
Cognitive applications are a cut above ordinary applications, as evident from the following basic features or characteristics.
Adaptive: Cognitive applications are adaptive, capable of integrating information around its ecosystem, as it changes. These systems feed on dynamic data in real time, or near real-time, to master ambiguity and unpredictability. It adapts to the changing goals and requirements of the enterprise, which is common in today’s highly fluid business environment.
Interactive: Cognitive applications interact easily with users, and also with other processors, devices, and cloud services. Such seamless interactions allow users to make explicit their requirements comfortably, and the network ascertains the requirements automatically to some extent.
Iterative: Cognitive applications are iterative and stateful. These apps ask questions or find additional sources by itself when a problem statement is ambiguous or incomplete. It also remembers previous interactions, and pulls in suitable information relevant to the current context, from such corpus.
Contextual: Cognitive computing applications understand and identify contextual elements such as location, time, meaning, syntax, processes, regulations, user’s profile, and more, connected to its ecosystem. The apps act on the basis of such information, automatically.
Dark Data Compatibility: Cognitive computing systems have the capability to deal with “dark data.” Traditional business intelligence and analytics solutions are mostly unable to comprehend social media postings, electronic medical record notes, electronic fitness device readings, unstructured images, and the bulk of general data generated by users in normal day to day settings today. Cognitive Computing apps process such multi-structured and unstructured dark data, to pull out non-obvious insights and subject it to analytics. Combining such dark data with the readily available structured information such as customer records unearth patterns, relationships, and other contextual associations not discernable otherwise.
Cognitive Applications in Action: Use cases
While cognitive computing has been around for quite some time, it is only recently, with the advancements in technology giving it a boost, that it has come to the mainstream. Several practical use cases have already emerged.
Many businesses now use cognitive computing applications to connect with their customers and other stakeholders at a more personal level and offer highly relevant recommendations. Such apps modify the recommendations automatically as they understand more about the stakeholder, and as the situation unfolds. Furthermore, such apps pick up subtleties that traditional analytics would miss.
IBM Watson, one of the earliest manifestations of a cognitive computing platform, already finds widespread use in healthcare. The cognitive computing platform collates the entire gamut of knowledge around a medical condition, such as patient history, journal articles, best practices, diagnostic tools, and more. It then analyzes the information, and offer a recommendation in sync with the changing condition of the patient. It is virtually impossible for any human to possess such vast range of information, leave alone analyze it. Doctors may leverage such insights to adopt evidence-based treatment options considering all factors, including the individual patient’s presentation and history. This is a big upgrade from the present scenario where the doctor makes educated guesswork, based on grossly incomplete information, with the decision based on the doctor’s limited range of knowledge. The insights available through cognitive computing enable even fresher doctors to perform as effectively as experienced specialists.
Cognitive computing applications are also making its mark in a big way to improve consumer behavior analysis, facilitate personal shopping bots, in education, diagnostics, and other areas. A good real-life example is Hilton Hotel’s Connie, the first concierge robot, which helps visitors with regards to hotel information, local attractions, and more, with questions posed in natural language rather than computing language.
Cognitive computing delivers positive ROI. Enterprises have already succeeded in applying it to convert even traditional cost centers such as customer care to profit centers. For instance, a packaged goods company applying cognitive computing to resolve customer problems automatically, pre-empting the usual practice of customers raising a ticket, could achieve a 30% reduction in tickets. Considering the cost of each ticket was $24 to $160, the savings are substantial.
Enterprises adopting cognitive computing, however, need to develop purpose-built applications to address specific use cases relevant to their stakeholders. Success depends on not just technical competence, but the extent to which the cognitive computing technology is interwoven with the business or customer needs.
There are components in business that ride the wave of time to have halo’s associated with it, when space, time and the event coincide, the companies that wear the halo accelerates its reach and hits the bull’s-eye. The resulting amalgamation of people, processes and ideas have time and time again celebrated success. This has been etched in stone, but what’s more contrasting and less surprising is that the components that create the halo is never the same and are subjected to disruption from around. There were innovations that elevated organizations and disruptions that have catapulted few others to the top. Particularly, the digital forces that once was touted as a disruption, which is now increasingly becoming the norm for the future.
The Whole Picture
Digital Transformation is not about islands of digitization like digital marketing, digital customer behavior or transformation from paper to digital media within an organization, rather it is a demanding process that requires considerable time, holistic thought and skilled people to guide the transformation process. The change has to be ideally driven from top-down, where the business leaders can put together the pieces of the digital puzzle thus enabling a rapid transformation in the business processes, activities and work models to move faster and efficiently to meet customer and business needs. This transformation of business by leveraging technology ultimately rests on the people who can drive the change into all layers of the organization.
Common Frontiers, Different Approach
Digital as the way forward is being experimented at varying degrees and varying pace by organizations. Some become more successful than the other to make this change a holistic one that touches the entire organization. The successful organizations show traits of digital maturity that touch different areas within an enterprise like Marketing, Operations, HR and Customer service; business models that unite these areas, and processes that embed efficiency through business automation, optimization, and management.
The foundation of successful transformation into the digital realm lies in organizational change, this change needs to address some key areas:
- For existing business, there is a need to take stock and understand why to transform, what to transform and how to transform. Once the reflection is carried out and you have figured out the answers to these questions, you should ideally start your mission to a digitally modified business. Improving on digital lines can help to have improved decision making by the use of big data, analytics, creating an effective corporate control, Risk optimization by automating manual labor, improved targeting with insights from customers, augmentation of traditional channels into digital and whenever wherever service propositions as well. Granted your journey would require much change from the status quo, and even you may not be as digital as a “Born Digital” company, but effective action can leverage the existing business, giving better reach to help multinational companies to truly have global operations.
- For an organization, Digital transformation process is multifaceted. Right from the beginning, it is essential that the organization has leaders with the potential to drive this change. The company has to make changes in their best practices in business architecture, BPM, continuous improvement, continuous innovation, crowd computing etc. Latest tools for robotics and sensors that can automate much of the mundane, so that the organization can focus on building lasting relationships with the customer. A mix of digital technologies, tools, and best practices can set the stage for Digital Transformation.
- The end part of the digital transformation is the customer experience. The models, the processes and the coherence of the activities carried out within an organization should ideally drive the customer journey with an emphasis on the physical and digital touch points. With Digital it is possible to effectively map this journey by understanding the way the customer interacts with business and brands, this invariably helps to find the best-fit solution for the customers. This is made possible through the combination of software, IoT, Big data, Mobile, CRM, Augments reality etc. In reality, a company may not be able to perform all these alone, it would have to seek partners that can run part of the show for them so that the companies can, in turn, focus on building their main offering.
The final touch points, like the interface, should invariably help the customer feel at ease and add touches of modernity. Looks aren’t everything, but when you and your competitor have the same product, looks, and a streamlined interface would come in handy
The Digital Wave doesn’t mean to throw away the method in which the business is being currently being conducted, rather it should dovetail and leverage the current best practices. When this is executed in the right way, the businesses can cater to a wider array of customers, speed to hit break even in shorter time, improve workflow employee efficiency within the organization. All companies irrespective of the segments they cater must invest proportionally so that risks can be mitigated and key opportunities are addressed in the most prudent way.

Gone are the days when marketing in retail, meant hours of trial-and-error based planning and strategizing. Marketing is no longer reliant on the marketer’s gut feelings or intuitions. It is moving away from being an art and is becoming more of a science now.
One of the major reasons that can be attributed to this shift is big data. Yes, the endless amounts of data that are being collected by businesses on an on-going basis are changing the game for retail nowadays. Business enterprises that leverage this data through analytics, and uncover useful insights are able to make their marketing plans more effective.
Isn’t it great when you are able to analyze what kind of products your customers are likely to buy, or what is the highest price that a customer of yours is willing to pay for a particular product? You get to channel your marketing efforts in the direction which is most likely to give you better profits with such information.
With predictive analytics, you get to garner all the insights necessary to personalize your marketing efforts for customers, making it much more effective and useful.
So here are some of the areas where you can use predictive analytics for personalization:
Customer engagement and revenue
 Predictive analysis helps to identify the different ways in which customers engage with retail sites. This information can be used to drive the desired level of engagement from the customers.
There are several solutions available in the market that can help you figure out or track customer behaviour. You can use those solutions to get a better understanding of what your customers are like, and have them adapt to your business model as your objectives evolve.
For example, retail giants like Amazon and Netflix, use predictive analysis to examine customer behaviour and develop solutions for their sales team to earn better and more qualified leads.
Amazon makes use of customer’s past purchases, details about their virtual shopping cart items, the items they have liked or rated etc. to decide and offer future product recommendations.
Netflix makes use of ratings made by customers on TV shows and movies to offer additional movie and show recommendations.
This way, predictive analysis tools help a great deal in obtaining information which when combined with a company’s already existing customer base, enables better and more effective marketing.
Better focused promotions
 Promotions are every retail company’s best friends. But to get them right and to get leads out of them, you need to make some serious effort.
Studies say that almost 98% of fast growing companies feel that targeting and market segmentation are extremely important for online merchandising but more than half of them are not completely satisfied with their promotional tools.
Predictive analysis can be used to avoid such situations and devise personalized promotional strategies that work for a particular customer or a particular segment, by combining data collected from various sources.
For example, Macy’s used a predictive analytics solution that focused on targeting registered users of their website and within three months, they saw an 8 to 12% increase in online sales. They used information related to browsing behavior and combined it with product categories to send out targeted emails to each customer or market segment.
Similarly, another retailer StitchFix sends out a style survey to customers, on the basis of which the customers are given recommendations on the clothes they might like, using predictive analysis.
Inventory management
Predictive analytics can be used in inventory management as well in order to prevent out of stock situations and to reduce overstock.
One retailer that revolutionized inventory management by introducing a system of Vendor Managed Inventory (VMI), was WalMart. They made use of predictive analytics to take it to an all new level, whereby they could reduce the inventory threshold for a product if the solution predicts no immediate sales for it. This allowed them to allocate their resources on products that are greater in demand and have the potential to increase profits.

Customer service
Many retailers face issues in customer service relating to whether or not they need phone service, if yes the number of executives required for phone-based support, live chat services, prioritizing questions from customers and the like.
Predictive analysis helps to set this line straight, by building a model that specifically meets the needs of the retailer. Over time, the model or the solution can be refined and modified for more accurate predictions and improve overall customer service.
For example, Red Hat which is a Linux distributor uses predictive analysis to enhance customer service by increasing “subscriber stickiness”. With their solution, they were able to provide solutions to customers, for problems they didn’t even know they had.
Hotel chains like Marriott also use predictive analytics tools with the aim of exceeding their customer expectations at all times.
Apart from these, there are many more areas where you can use predictive analysis.
However, merely using a predictive analytics solution and dumping data in is not enough. They are not plug and play solutions, that take data in and generate revenues. You need to work with skilled data analytics personnel to make sure that your investments in predictive analytics are not wasted. You need analytics experts to make the most out of big data. Once you have the right solution as well as the right personnel in place, then you are not far away from effective marketing.
Traditional dashboards, by definition, were meant to provide an “at-a-glance” view of the state of affairs of a business. As a matter of fact, there were web analytics experts who asserted that a dashboard that does not fit in a single page were not dashboards at all and that they were just reports.
According to Avinash Kaushik, Digital Marketing Evangelist at Google, “If your dashboard does not fit on one page, you have a report, not a dashboard…..This rule is important because it encourages rigorous thought to be applied in selecting the golden dashboard metric.”
Now, if this was just one of the few constraints that applied to the conventional belief in one-page dashboards, it would have been a different scenario. But referring to a constraint, as a rule, leads to the assumption that there is only one possible means to achieve the results. I find that it limits the scope of a dashboard and thus affects the effectiveness.
THE TRANSITION
Given that the purpose of a dashboard is to give an accurate, concise and effective description of what the users want to see, limiting it to pages or screens did not seem to be the brightest of ideas. And apparently, this was not just what I thought. As time flew, and as technology conquered whole new levels, people slowly realized the paradox – In the age of touch screens and interactive user interfaces, having single page dashboards is like owning the old heavy and fist-thick mobile phones in place of smartphones.
Not that the old dashboards did not serve the intended purpose at all. They did justice to what they had to represent in those times. But now, with the changes in technology and data and analytics, we are forced to move away from such principles for a number of reasons.
WHAT LED TO THE PHASING OUT OF ONE-PAGE DASHBOARDS?
One of the major reasons why dashboards longer than a page were considered to be sins was the grudge against “scrolling”. How can we possibly ask them to scroll or navigate when they are looking for information “at a glance”?
But now, with touch screens and gestures, navigation, on the whole, let alone scrolling has become easy as ever. Such kinds of interaction methods have actually extended what users used to consider as single screens. There are many marketing sites as well these days, that make use of vertical scrolling for navigation and have immense traffic. It also shows how people have changed and got accustomed to new ways of technology.
Interactive interfaces
Earlier (much earlier), dashboards were mere static documents with a high-level overview of the data with no chance for the users to interact with it. Then came a little more sophistication with spreadsheet software, having advanced features to make dashboards interactive. Again, there were limitations. So the basic idea of interacting with the data, and being able to extract desired specific information, led to the expansion of the scope of dashboards and without much thought, one-page dashboards can be put out of the picture.
Only the specifics
As is the case with most people these days, lack of time and attention span, limit their ability to view and understand things properly. With smartphones, tablets, and smartwatches, people are seeking only the most relevant information and that’s what they deliver. Only specific or the most critical information is delivered and the rest is only given as a choice (on request). This new ask-and-get mode of information exchange does not really fit well with one-page dashboards. We cannot expect people living in this age to analyze data from a single page, crammed with data, figures and illustrations.
Even with all the technological influences, the purpose of dashboards remains the same – to show the big picture in the easiest, most comprehensive way possible. And today’s technology is a great means to achieve that goal. Dashboards today, do more than just providing insights. They also guide the users through the data and help in making actionable decisions. Single-page dashboards, cannot do any of these and are hence phased out!
Enterprises today have to deal with a fast paced business environment and truck loads of data coming from all directions. In order to keep up in the race for survival, organizations need to be as agile and alert as possible to overcome the challenges and adapt to the environment. Within the organizations too, data is growing rapidly. With all these complexities, it is necessary for the business managers to make some sense out of the incoming data on time and use it to boost the efficiency of their company.
In other words, the key to the success of any business lies in extracting relevant and actionable insights from the generated data, from anywhere in the world, in an organized and secure manner. It helps managers in making better, more informed decisions and thereby seize every opportunity that may come.
So what can be done to garner such insights? Or rather, what can be used to aid the process of decision making?
The answer is Corporate dashboards. We are all familiar with that term aren’t we? We also know that it is one of the most reliable and effective decision-making tools, as it helps managers get an overall top view of their enterprise by extracting Key Performance Indicators (KPIs). It also enables an easy analysis of the metrics in a user-friendly manner.
Using such dashboards helps organizations improve their efficiency as well as save a lot of time and money. It also adds to the reputation and goodwill of the company as a result. And how?
Before we get into the benefits of using dashboards, let’s see why organizations need dashboards.
Why dashboards?
Every manager in an enterprise, at whatever level of management he may be in, is responsible for decisions concerning his department or division. He has to go through and understand the corporate goals and at the same time manage his own department or team to achieve the goals set for his team. For this purpose, he will have to sift through various spreadsheets, reports and databases across the enterprise to collate information and make the best decision. However, he may not have the time for all this. On top of that, not all users may have access to all the information required to make decisions. These problems may make it difficult for the managers to make decisions.
Dashboards, on the other hand, provide a clear and concise picture of the state of affairs, by integrating data from various sources into a single common platform. It presents such data in the form of insightful graphics, patterns, and the like and also highlights the pain points that require immediate attention.It enables managers to easily make faster and more accurate decisions.
How dashboards save you time, money and reputation
Typically, dashboards offer a number of general benefits such as:
- faster access to information
- ability to generate comprehensive reports
- graphical presentation of real time data
- better visibility into all required departments
- better transparency
- availability of all information in a single place
- insightful illustrations
To discuss how dashboards help in saving time and money, let’s consider a hypothetical situation.
You, being the sales manager of a leading advertising company, are psyched on winning a project with an international client. You are about to reap huge profits and take your company to new heights. On being the sole person creditable for this huge deal, you are required to give a presentation to your team regarding the client and the project. You have prepared your work with the help of presentations and reports and spreadsheets for accounts. Finally, on the day of the presentation, as you stand in front of your team with your laptop, you realize that you haven’t transferred your file from your personal system where you created it. You also find that the spreadsheet that you created does not have a whole page as you forgot to save it…..
The above scenario is the result of using traditional methods of presentation or work. Such spreadsheets and reports create a whole lot of confusion and complexities that you can actually avoid using dashboards. Imagine, having a dashboard that lets you access your client’s information directly in real-time. One that lets you extract specific relevant information in the form of reports on the spot, in case you want to show some financial information.
Dashboards allow you to get all the important information in a single place, rather than through separate files and reports. It thus lets you save a lot of time that you would otherwise have spent on making the presentation with spreadsheets and documents, collating information from various departments etc. It also lets you save money used in buying and maintaining spreadsheet software and in making frequent visits to your client’s site.
Using dashboards for presentations during client visits and the like, boosts your reputation as well as it shows that you have your operations under control and in one place. Moreover, the visibility that lets you access information from other concerned departments shows that there is transparency, which adds to the trust factor. Moreover, you can allow your client to filter the data according to his requirements.
Such interactive and insightful dashboards, made with simple graphics such as pie charts, bar charts and the like, basically make your work very much easier. Being dynamic and flexible, dashboards can be created to suit your business model and can adapt itself to your company’s look and feel. If you are looking for a way to integrate information from different departments in your organization, contact us.

According to a recent report by InformationWeek on business intelligence, up to 28% of business professionals responsible for software selection in their firms, said that they have set the standards for one or a few analytics products in their organization. It was 35% last year, so this time apparently we have a 7% decrease.
Now, why has there been such a decrease?
The answer is not very different from what it was for the last three years. Almost 48% of BI decision makers say that “ease-of-use challenges with complex software or less technically savvy employees” is one of the main barriers to its increased adoption. Another major factor being data quality issues.
Although, the survey also found another 21% of decision makers did adopt several analytics and BI products for their firms, which is an increase from 16% from last year.
According to two different schools of thought, there have emerged two different approaches to developing and using analytics software. One school believes that if software, is simple to use, then people can handle even complex analysis. On the other hand, another school believes that if the software is made to be smart, then it can handle the analysis part on its own. So, it all comes down to choosing between simpler or smarter.
Products such as Qlik Sense, Tableau Elastic fall in the “simple to use” category and other popular ones from IBM and SAS fall in the smarter category. Tableau has gone as far as making their software mobile compatible too, adding further to the ease of use. A recent development by IBM is Watson analytics, a cloud-based service that is sure to help in high-end data analysis.
Even though, the choice has to be made between simpler or smarter software, the ultimate fact is that most people prefer software that is both smart as well as easy to use. Our own product ReachOut Engage intends to bridge this gap with an easy to use interface and allows users to analyze the data on a primary level and export data to third-party systems for further analysis. According to the survey, IBM and SAS also argue that their software uses smart features that also make it easy to use. Even then, this idea of smarter versus simpler when put in front of Steve Rimar, senior staff, IT architect at Qualcomm, brought 2 distinct vendors to the limelight. This renowned BI and analytics practitioner said that they have used many tools over the years and QlikView and Oracle OBIEE have proved to be their dominant standards.
When we look into the databases used, the report shows that 26% of decision makers involved in the survey, said that their firms used NoSQL databases, which is an increase from 19% in the last year. Another 22% said that their firms used Hadoop, which again, is an increase from 15% in the last year. Now, Hadoop is one database which is steadily and definitely gaining adoption as a platform for storing high-scale data that is not capable of being stored in other relational databases. Some of the major reasons for this increase in adoption rate include:
- Ability to store and process semi-structured, unstructured and variable data as pointed out by 31% of respondents
- Ability to handle massive volumes of data as pointed out by another 30% of respondents
- Low hardware and storage scaling costs as compared to conventional relational database management systems as pointed out by another 25%
All these facilitate big data analysis. All these also indicate the growing interest in big data analysis. Now, what exactly are the factors that drive this growing interest?
Some of the reasons are:
- The need for finding correlations across multiple data sources like internet clickstreams, geospatial data and customer transaction data as cited by 48% of respondents
- The need for predicting customer behavior as cited by 46%
- The need for predicting product or service sales as cited by 40%
Other major reasons include the need for predicting fraud and financial risks, analyzing social networks and identifying security risks.
On the whole, big data analysis is no longer just data warehousing as we know it at high scale as the report suggests. So, the bottom line is to not just depend on SQL tools alone to learn new things and use new data sources. As other tools are gaining popularity, data analytics and business intelligence and information management are becoming simpler and smarter.

One thing that is inevitable in every business enterprise, irrespective of size or industry, is decision making. It is also the one thing that is common to all managers irrespective of the level of management. As a manager, the performance of your team or company depends on the decisions you take for it. Therefore, the better your decisions are, the better will be your company’s performance.
In order to support you in your decision-making process, it is important to use the best possible tools so that you can make better, more informed decisions. One such tool, that makes use of analytics and makes internal decision making in an organization a lot easier is interactive reports or dashboards.
Of late, dashboards have become one of the most popular business intelligence tools, because of several reasons, the major one being that it is a lot cheaper. Apart from that there are several benefits. Here we describe an instance where we created dashboards for a US based client called Premium Retail, who specializes in providing retail solutions and helped them increase efficiency.
The dashboards (web applications) that we built for Premium Retail were highly interactive and insightful. We made two sets of dashboards in order to capture the Key Performance Indicators (KPIs) of their field agents and to show the coverage (channel coverage) percentage of the different divisions of the organizations. These dashboards converted the large amounts of data, handled by managers, into user-friendly visualizations which made analysis and interpretation much easier. They also had interactive charts with different kinds of filters which further helped in gaining critical insights in a matter of a few clicks. In all, the intuitiveness of these dashboards gave way to the following benefits to the organization.
- Better understanding of business operations – As all of the business flow/ logic was captured in a single application, it became easier for the managers to monitor and check for discrepancies or anomalies and take corrective decisions. For example, the dashboards showing the coverage percentage enabled the managers to get a snapshot of overall channel coverage nationally or state wise or even market or zip code wise very quickly and easily. Hence, the managers got a better understanding of the state of affairs which in turn helped them take better decisions.
- Better understanding of low-performance areas and employees – The dashboard was also used for tracking the performances of the field agents based on which the ones that require extra training and development could be narrowed down. It helped the managers take corrective actions in this regard and do the necessary in bringing up the efficiency and productivity of the employees ultimately improving the profit margin.
- Better time management – The managers of Premium Retail received huge amounts of data on a monthly basis and hence analyzing and interpreting them took a large amount of time earlier. But with these dashboards, the time they were able to save on analysis was massive. It helped them reduce the man hours required for interpreting the huge data points. They were able to garner useful and relevant insights very easily making the entire management of the data, a much easier and time-saving task.
- Budget control – These dashboards required only the initial costs of deployment. Hence, they were able to keep the costs that were involved in the analysis of data, well under check. For example, the cost of human resources required for analysis of the data could be reduced by a huge margin, as the installed dashboards could do the task.
All these benefits helped them bring up the productivity of their employees as well improve the efficiency of the organization as a whole.
With such performance tracking dashboards, you will be able to judge the efficiency of their employees whereby you are in a position to take better decisions regarding his employees. This improves your credibility and efficiency from the point of view of the top level management which increases your chances for promotions and appraisals as well. Dashboards not only help in increasing the efficiency of managers and department heads but also of the employees which in turn improve the overall efficiency of the organization as well.
Do you need help in managing large volumes of data and in developing useful insights out of the data? Talk to us! We can help you develop and enforce a custom software for your data and analysis.


