Category: Data Visualization
The year 2017 has been eventful for digital transformation, with technologies such as Big Data coming of age. Digital transformation promises to be more disruptive in 2018, as evident from the following predictions.
1. IoT Becoming Mainstream
The much-hyped IoT will walk its talk fully in 2018. About 8.4 million “things” are already part of the IoT ecosystem, a 30% increase from last year’s levels. Enterprises will start using IoT to deliver better products, services, and insights. IoT will permeate to the masses, and become mainstream and commonplace.
Among specific sectors, IoT will revolutionize analytics in a big way, driving new smart solutions. A few possibilities include hyper-efficient fleet operations, intelligent traffic signals, and more. Tech giants such as Microsoft, IBM, SAS, and SAP are all heavily investing in IoT Analytics, offering a portent of the things to come.
2. Edge Computing Offers Effective Real-Time Processing Solution
The cloud and Big Data analytics analyze tons of data seamlessly. However, the sheer volume and velocity of data create time lag and some inefficiency. For instance, the cloud, for all its advantages, is not viable for IoT powered smart drones, autonomous vehicles, and other AI-powered smart devices. These devices need real-time and instantaneous data processing. Sending data from these devices “all the way” to the cloud is an inefficient and impractical method of processing data.
Edge computing, which performs data processing at the edge of the network, near the source of the data, promises effective solutions to the shortcomings or limitations of the cloud and big data. Edge computing, for instance, allows IoT powered devices to connect and communicate instantly and seamlessly.
Industry biggies, such as HPE and CISCO have already rolled out hardware and software to actualize Edge computing. IDC predicts 40% of all computing to happen at the edge in the next couple of years.
3. Enter the 5G Network

4G or fourth-generation wireless, synonymous with LTE (Long Term Evolution) technology, went mainstream in 2017. 5G of fifth-generation wireless will go gain ground in 2018. The need for hyper-connectivity and IoT propels the need for 5G.
The Next Generation Mobile Networks (NGMN) Alliance defines 5G as “an end-to-end ecosystem to enable a fully mobile and connected society.” 5G is not an incremental upgrade over 4G or LTE.
While the 4G focus is on raw bandwidth, 5G focuses on pervasive connectivity and super-dense network, enabling even faster and resilient access to the Internet even from the remotest caves or desolate hills. Unlike the hitherto monolith networks entities such as 2G, 3G or 4G, 5G co-opts a combination of technologies, including 2G, 3G, LTE/4G, LTE-A, Wi-Fi, and more. While emerging technologies and solutions, such as IoT, connected wearables, augmented reality and immersive gaming places a great strain on incumbent networks, 5G will run these technologies seamlessly.
Industry majors such as Sony and Samsung are investing in Gigabit LTE, the stepping stone between the incumbent LTE and 5G. The already well-entrenched Qualcomm Snapdragon technology powers Gigabit LTE. However, 5G will become a household technology only by 2020.
4. Blockchain finds Its Way
Blockchain, the secure transaction ledger system distributed across a network of computers, rather than under any single entity, will finally become mainstream by 2018. The financial industry has already started to embrace blockchain in a big way. The healthcare, entertainment, and hospitality sectors are on the verge of embracing it in a big way. Dubai is rapidly moving toward becoming the world’s first-ever blockchain-powered government by 2020.
5. Artificial Intelligence Becomes Mainstream
The market size for AI is set to double up from $2420 million in 2017 to $4066 million by 2018.

Solutions powered by Artificial Intelligence are already popular. Artificial Intelligence already powers many popular solutions, such as Alexa, Siri, Salesforce Einstein CRM, IBM Watson, SAP Leonardo, Netflix, Amazon AI, Cortana Intelligence Suite, and various customer service chatbots.
Companies will continue to roll out cutting-edge solutions based on Artificial Intelligence, especially to implement smarter and cheaper automation. The scope of artificial intelligence would expand to encompass everything from emails and content generation and from industrial manufacturing to smart grids. In fact, major companies will embed Artificial Intelligence into their core operations. Fueling the growth of Artificial Intelligence is the spread of open-source solutions. Artificial Intelligence cannot easily be integrated into closed systems.
With more investments being made betting on Artificial Intelligence, Virtual Reality is losing the race significantly because Artificial Intelligence offers whatever Virtual Reality offers, in a much cheaper and better way. For instance, companies can apply 3-D visualization to train, pitch, and envision new products in a much better way than what Virtual Reality offers.
6. Anything as a Service
XaaS or “Anything as a Service” is now within the realms of possibility. The cloud-based services market now encompasses software, infrastructure, and everything else. The latest to enter the “as a service” market is a framework! Framework-as-a-Service (FaaS), which falls between SaaS and PaaS is a customizable cloud-based platform. Users may indulge in rapid prototyping, visualization, and other fast fail methods to discover whether a concept or strategy will work or not. Companies get to know the result of their initiative, without having to spend time and effort, doing it the hard way.
Side-by-side with FaaS, workplace-as-a-service (WaaS) and unified-communications-as-a-service (UaaS) will also become mainstream in 2018. Remote workplaces, powered by WaaS, will rise in a big way by 2018.
7. Low Code Platforms to Soar in Popularity
Low code development platforms (LCDP) will net a total revenue of $6.1 billion by 2018, and over $10 billion by 2019. These figures are impressive when compared with the total revenue in 2015 which was just $1.7 billion.

LCDPs allow creating apps through a configuration of functions, and intuitive drag-and-drop options, rather than by hand coding. The obvious advantage is ease of development and accelerated delivery of business applications. Acute shortage of talented programmers fuels the growth of LCDPs.
Some popular LCDPs, as of now, are Appian, Mendix, Google App maker, and Zoho Creator. The growing popularity of such low-code development platforms will spur ‘citizen development’.
Technology is always fluid. Companies who embrace the latest technology head-on to deliver better solutions for its customers stand to reap dividends. Companies who do not change will surely be swept away into obsolescence.
Stay up to date on what's new

About the Author

Featured Blogs


Stay up to date on
what's new


Talk To Our Experts
Cognitive computing in a broad sense refers to software mimicking the functioning of the human brain, to make better decisions.
Computers have caught on ever since its inception, owing to its ability to undertake lightning-fast calculations, much beyond the range of human capabilities. However, computing devices face a serious limitation in not being able to accomplish tasks humans take for granted, such as understanding the natural language or recognizing unique objects in an image. While artificial intelligence offers a start in this direction, cognitive computing represents the coming of age in this front.

Cognitive computing, in a sense, represents the third era of computing, with computers that could tabulate sums the in-thing in the 1900s, to programmable systems in the 1950s, and now cognitive systems.
Personal digital assistants such as Siri, already present in smartphones come close to cognitive computing but are not true cognitive systems. Such systems can only respond to a preset number of requests, whereas true cognitive applications give a thoughtful response, without being restrained to a preprogrammed response set.
How Do Cognitive Applications Work?
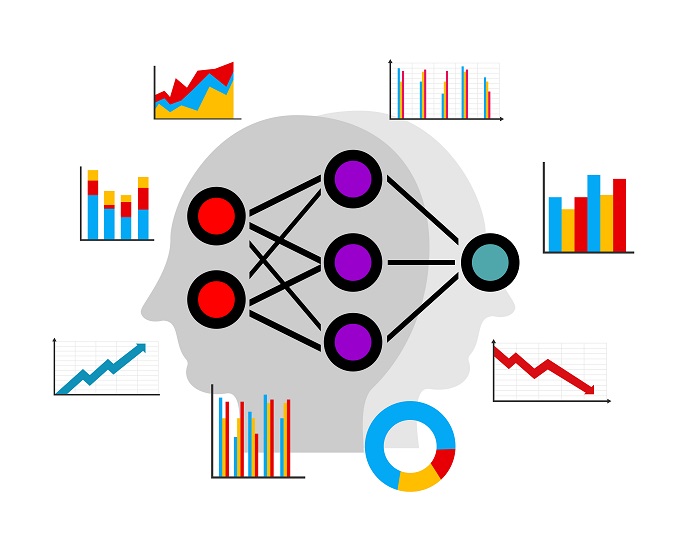
Cognitive computing aims to simulate human thought processes in a computerized model. To this end, cognitive applications use deep learning algorithms and neural networks and leverage the latest technological solutions such as data mining, natural language processing, and pattern recognition.
Cognitive applications draw on multiple sources of information, including structured and unstructured digital information, sensory inputs such as visual, gestural, auditory, information, sensor-provided information, and more. It then processes the gathered information by comparing it to the set of data it already knows. As such, the more data the system encounters, the more it learns, and the more accurate the system becomes, over time.
Cognitive computing applications integrate data analysis with adaptive page displays (AUI) to tailor content for the specific audience and specific situations.

IBM Watson, one of the earliest approaches to cognitive computing, offered a path-breaking combination of natural language processing, machine learning, and knowledge representation. Watson ingests questions or inputs in natural language mode, search its repository for information, develops and analyze hypotheses on its own, and generates answers, also in natural language mode. What made Watson successful was not just the combination of the multiple capabilities, but the seamless and powerful integration of such different capabilities in a way it influences each other.
Basic Characteristics of Cognitive Applications
Cognitive applications are a cut above ordinary applications, as evident from the following basic features or characteristics.
Adaptive: Cognitive applications are adaptive, capable of integrating information around its ecosystem, as it changes. These systems feed on dynamic data in real time, or near real-time, to master ambiguity and unpredictability. It adapts to the changing goals and requirements of the enterprise, which is common in today’s highly fluid business environment.
Interactive: Cognitive applications interact easily with users, and also with other processors, devices, and cloud services. Such seamless interactions allow users to make explicit their requirements comfortably, and the network ascertains the requirements automatically to some extent.
Iterative: Cognitive applications are iterative and stateful. These apps ask questions or find additional sources by itself when a problem statement is ambiguous or incomplete. It also remembers previous interactions, and pulls in suitable information relevant to the current context, from such corpus.
Contextual: Cognitive computing applications understand and identify contextual elements such as location, time, meaning, syntax, processes, regulations, user’s profile, and more, connected to its ecosystem. The apps act on the basis of such information, automatically.
Dark Data Compatibility: Cognitive computing systems have the capability to deal with “dark data.” Traditional business intelligence and analytics solutions are mostly unable to comprehend social media postings, electronic medical record notes, electronic fitness device readings, unstructured images, and the bulk of general data generated by users in normal day to day settings today. Cognitive Computing apps process such multi-structured and unstructured dark data, to pull out non-obvious insights and subject it to analytics. Combining such dark data with the readily available structured information such as customer records unearth patterns, relationships, and other contextual associations not discernable otherwise.
Cognitive Applications in Action: Use cases
While cognitive computing has been around for quite some time, it is only recently, with the advancements in technology giving it a boost, that it has come to the mainstream. Several practical use cases have already emerged.
Many businesses now use cognitive computing applications to connect with their customers and other stakeholders at a more personal level and offer highly relevant recommendations. Such apps modify the recommendations automatically as they understand more about the stakeholder, and as the situation unfolds. Furthermore, such apps pick up subtleties that traditional analytics would miss.

IBM Watson, one of the earliest manifestations of a cognitive computing platform, already finds widespread use in healthcare. The cognitive computing platform collates the entire gamut of knowledge around a medical condition, such as patient history, journal articles, best practices, diagnostic tools, and more. It then analyzes the information, and offer a recommendation in sync with the changing condition of the patient. It is virtually impossible for any human to possess such vast range of information, leave alone analyze it. Doctors may leverage such insights to adopt evidence-based treatment options considering all factors, including the individual patient’s presentation and history. This is a big upgrade from the present scenario where the doctor makes educated guesswork, based on grossly incomplete information, with the decision based on the doctor’s limited range of knowledge. The insights available through cognitive computing enable even fresher doctors to perform as effectively as experienced specialists.
Cognitive computing applications are also making its mark in a big way to improve consumer behavior analysis, facilitate personal shopping bots, in education, diagnostics, and other areas. A good real-life example is Hilton Hotel’s Connie, the first concierge robot, which helps visitors with regards to hotel information, local attractions, and more, with questions posed in natural language rather than computing language.
Cognitive computing delivers positive ROI. Enterprises have already succeeded in applying it to convert even traditional cost centers such as customer care to profit centers. For instance, a packaged goods company applying cognitive computing to resolve customer problems automatically, pre-empting the usual practice of customers raising a ticket, could achieve a 30% reduction in tickets. Considering the cost of each ticket was $24 to $160, the savings are substantial.
Enterprises adopting cognitive computing, however, need to develop purpose-built applications to address specific use cases relevant to their stakeholders. Success depends on not just technical competence, but the extent to which the cognitive computing technology is interwoven with the business or customer needs.
Stay up to date on what's new
About the Author
Featured Blogs
Stay up to date on
what's new
Talk To Our Experts
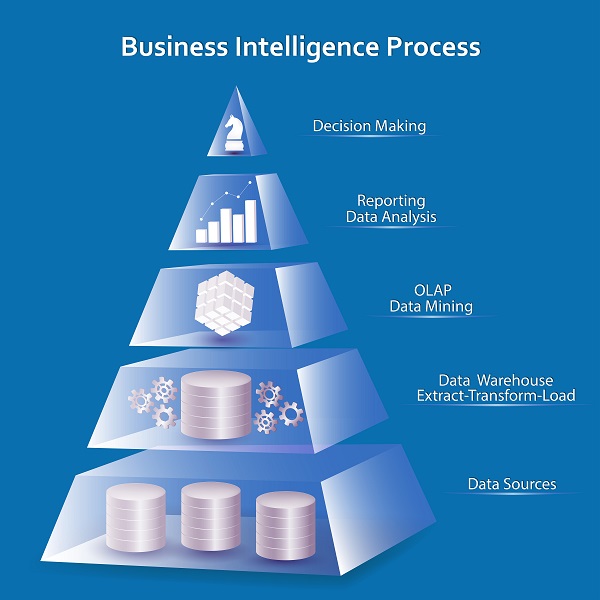
What is Business Intelligence?
Business Intelligence (BI) turns data into information. It is the sum of applications, technologies, and methods adopted to glean strategically relevant information for the business. The task involves collecting, integrating, analyzing, and applying historical, current and predictive information related to the business. The objective is to gain strategic insights, evaluate risk, and improve decision-making capabilities for top management, business owners, and other stakeholders.
Business intelligence information encompasses both internal data and external data related to the business. Internal data may include operational data, data from sales, financial data, and more. External information is fairly wide in scope and may include information from the external supply chain, social media channels and more. Another dimension to external information for business intelligence is information about competitors and other companies, for benchmarking, and to gain a competitive edge over such companies.
Many businesses now apply business intelligence to make informed decisions, rather than relying on hunches or unfounded assumptions. For instance, restaurant owners use business intelligence to decide the menu to be added and removed from a restaurant menu. Automobile manufacturers apply business intelligence to add new features to their car models. Tour operators use business intelligence to optimize their itinerary. The possibilities are endless. Businesses may use Business intelligence to modify their internal work processes as well.
Business Intelligence Vs. Analytics
One might mistake Business Intelligence as being another name for the much-hackneyed business analytics. While both business intelligence and analytics involve aggregating and analyzing data, the similarity ends there.
Business intelligence aggregates data to make it explicit what is happening to the business, whereas analytics aggregate data to delve into why it happens. For instance, business intelligence evaluates sales performance by extracting data from various sources and presenting it in the form of intuitive graphs. Analytics involves running statistical tests to make explicit whether sales performance correlates with advertisements and promotions undertaken.
While both business intelligence and analytics involve analysis of data, the scope is markedly different. In a sense, Business Intelligence ends with the basic mathematical operations of addition, averages, and percentages to the dataset. Applying advanced algorithms complex formulas, statistical operations such as regression analysis, correlation analysis, and more, to answer deeper questions related to the dataset comes from the realm of analytics.
Technically, Business Intelligence encompasses ETL tools to access and transform data, OLAP (online analytical processing) tools to handle complex queries, tools to manage metadata, development tools to generate various reports and dashboards, and others tools for publishing, scheduling and distribution capabilities. Analytics co-opt different methods of analyzing information, such as descriptive, predictive, regression, neural networks, and the tools to apply such methods.
What is a Business Intelligence Software?
Business intelligence software enables enterprises to undertake business intelligence tasks.
Any Business Intelligence system worth its byte involves the following activities, and software to undertake such activity.
- Data warehousing, or bringing together all data, such as sales data, operational data, data from financial reports, competitor sales data, social media talk, and more. ETL (extract-transform-load) tools usually facilitate the task of extracting data from several databases, systems, and applications, transforming it as required, and loading it into the target data warehouses, analytical applications, and other systems.
- Data visualization, or presenting the information in a visually appealing way, for users to make sense of the data in a better way. There are different visualization types, such as charts, graphs, infographics, and more, and various enabling tools for each type. Each visualization type serves a specific purpose. For example, Pie charts are best suited to communicate relative performance, whereas bar charts depict trends in the best way. Some intuitive methods such as “slice and dice” are gaining popularity of late, for its powerful capabilities.
- Management dashboards, or well-grouped set of visualizations containing most relevant information to any stakeholders, usually reserved for top management. OLAP tools, used to aggregate data and handle complex queries, are commonly associated with Business Intelligence
Several types of tools enable data visualization and management dashboard capabilities.

- Spreadsheets such as MS-Excel are the most common method of presenting the Business Intelligence data. The ease of work nature and universal availability of spreadsheets are however marred by serious limitations, such as limited security, limited collaboration features, limited automation capabilities, and a high degree of inaccuracy and variability. Various other tools offer seamless and advanced automation, security, and audit capabilities, which MS-Excel lacks.
- Operational reports, often custom made for the enterprise, list data at a very detailed level, in a highly-structured and logical format.
- Querying and analysis solutions allow business users and analysts to generate business queries and reports rapidly. The ad-hoc nature of these tools offers unbridled flexibility. These tools also come with intuitive graphical interfaces. A middleware layer which converts database conventions to normal business nomenclature, and dashboard drag-and-drop functionality spares end-users from the need for technical proficiency to use these tools.
- Dashboard management systems offer easy access to key information in intuitive and graphical formats. It displays the required set of key performance indicators, metrics, and other relevant information in a single consolidated view, greatly improving the user’s decision-making capabilities.
- Data mining tools allow analyzing large data sets to discover patterns and build predictive models. data mining application use algorithms, statistics, advanced mathematical techniques, and sophisticated data search capabilities, to unearth insights otherwise not discoverable.
- Online analytical processing (OLAP) tools facilitate the rapid visualization and analysis of business metrics. Users may store and access data in multidimensional OLAP cubes comprising of measures, and text values. Queries from OLAP cubes are much more powerful than simple database tables and offer users advanced insights into past performance and various “what-if” scenarios. Users may use such cues to evaluate information from various dimensions and perspectives. In fact, OLAP operations constitute the fundamentals of most advanced functionality used by data visualization tools.
Top Business Intelligence Tools 2017

Until a few years ago, users had a limited choice of comprehensive Business Intelligence tools. The choice was limited to platforms offered by biggies, such as IBM, Oracle, SAP or Microsoft. The high cost of the software and the associated complexities made business intelligence out of the reach of most enterprises, except big corporations.
The advent of the cloud changed things, making business intelligence more democratic. Business no longer needed to build their own BI infrastructure in-house, as SaaS providers perform the resource-intensive tasks of data gathering, persisting and reporting, allowing businesses the ease, affordability, and convenience of the subscription model.
Some of the top ETL tools include Oracle Warehouse Builder, SAP Database Services, IBM Infosphere Information Services, SAS Data Management., Elixir Repertoire for Data ETL, SQL Server Integration Services (SSIS), and more.
Some of the top OLAP tools in vogue include Yellowfin, Stratum, Birst, Profitbase BI, and the quintessential Microsoft SharePoint, among others.
Here is a rundown of some of the leading data visualization and dashboard software in 2017
- Dundas BI, one of the most popular browser-based business intelligence and data visualization platform, offers integrated dashboards, reporting tools, and data analytics capabilities.
- Domo, A cloud-based suite, makes it easy to integrate multiple data sources, including databases, spreadsheets, social media and also legacy cloud-based and on-premise solutions deployed in the enterprise.
- SiSense support business data with powerful visuals and tools, making it handy for users with little or no technical skills.
- BOARD, a centralized tool, hosts data and conducts multidimensional analyses. It boasts an impressive client list, which includes US Navy, Giorgio Armani, and Puma, among others.
- IntelliFront BI enables viewing multiple data sets from a single pane. It also distinguishes itself with strong automation features, real-time dashboards, and on-demand reporting.
Self Service Tools
The emerging trend of self-service business intelligence, made possible by the advancement of mobility, analytics, and other relevant technology, empower end-users with the ability to undertake business intelligence tasks by themselves, without necessarily having advanced technical skills.

As it is with several other sectors, Google has also entered the business intelligence space, and with time, is sure to give established incumbents a run for their money. It is now possible to build an intuitive BI dashboard powered by Google Data Studio reporting tool and Google BigQuery, a cloud-native data warehouse capable of analyzing petabytes of data in double quick time. As always, all these Google tools are open-source and free, giving developers the unbridled freedom to co-opt it in their systems, the way they want it.
Google’s new offering competes with Microsoft Power BI, another free, self-service cloud-based business intelligence offering from the Microsoft staple. Non-technical users may leverage this offering for aggregating, analyzing, visualizing and sharing data easily.
Businesses would do well to consider developing custom suites facilitating such self-service options, integrating ready-to-use Business Intelligence tools to the extent required. Partnering with a competent IT software solutions provider would enable the business to roll out highly intuitive business intelligence apps and other solutions, empowering end-users to gain the required insights easy and fast, without having to wait for the IT team to do the job and spoon-feed them with reports.
Stay up to date on what's new
About the Author
Featured Blogs
Stay up to date on
what's new
Talk To Our Experts
In today’s digital age, a website is your business’ window to the world, irrespective of whether you are a brick and mortar establishment or an online entity. Similarly, the need for a dedicated website is not just limited to startups but is equally vital for established business. Even if your business is doing exceptionally well, investing in a well-designed and responsive website can help you reach out to a wider cross-section of the audience and increase your sales manifold.
Here is rundown on how custom website development services can turn the tide for your business:
Website Development and Its Advantages

Custom web development is one of the finest things you can do to guarantee the success of your business. In addition to improving your visibility, customized website development can help your business in the following ways:
- Customized website development boosts your credibility and adds a certain brand authority to your business.
- A professional-looking website can bring you big gains without an astronomical investment, thus, offering a higher return on investment (ROI) than traditional means of advertising.
- It does not matter whether you are a newbie or a seasoned market player, there is bound to be competition in your realm of trade. A dedicated website can assist you in leveling playing field and even beating your competitors.
- It boosts your advertising and marketing endeavors across different channels. Your social media marketing and email marketing campaigns are likely to resonate better with your audience if these lead them to a website.
- Custom designed websites are cross-browser well-matched.
- Custom developed websites also costs nearly same as of any template based solution. They may have little higher cost but offer numerous benefits and total control on each part and role of the website.
Specialized, clean, and well-organized online presence is essential for preserving your brand reputation. General designs can create a negative impression of the product or service quality, the reason being customers see you as no dissimilar from thousand other companies. The website represents your business in terms of superiority, quality, and individuality, so you need to have one developed skillfully.
Importance of Multiple-Channel Presence
At a time when smartphones and handheld gadgets rule the roost, the number of people accessing websites through a desktop computer is fast dwindling. Almost everyone likes to browse the internet on the go. Therefore, a website with a responsive design – that ensures your website is displayed correctly and uniformly across platforms, devices and screen sizes – is essential to stay relevant in the dynamic online landscape.
As per statistics, whopping 67 percent users are more likely to use an enlisted service or buy products on a website with a clean, responsive design. In contrast, 61 percent users are likely to exit a website with an unfriendly layout and design. The bottom line is – a potential user may bounce back from your website and move to that of your competitors if you don’t cater to a multiple-channel presence.
How Digital Marketing Can Help
Building a website from scratch is no big deal, given the user-friendly content management systems like WordPress. Even so, if you really want to make an impact with your web presence, it is advisable to use professional custom website development services because you don’t just need to build a carefully-strategized site but also work toward improving your search engine rankings to attract massive traffic. People will know that you exist, only when your website is visible in search engine results. A smart digital marketing campaign can help in bolstering your web presence to clock-in tangible gains.
Stay up to date on what's new
About the Author
Featured Blogs
Stay up to date on
what's new
Talk To Our Experts
Enterprise software solutions are the backbone of an organization. Selecting one for your organization is a great responsibility as it requires detailed analysis at each and every step. The major challenge lies in understanding that every organization’s structure is different and cannot do with the same software that was used in your previous organization or is used at the competitor’s company. To make your task easy, here are 8 challenges to avoid before purchasing an Enterprise Software.
1. Change Management
One of the key understandings that should come with a new Enterprise Software is that there is a need for identifying the changes in the IT infrastructure beforehand and then implementing it. Know how much change is required and if it is possible to handle before purchasing the new software. Also, the employees need proper training for change management and to get them comfortable with the new system before it goes live on an organizational scale.
2. Physical Requirements
Before jumping into a purchase decision, figure out what is the current IT infrastructure landscape, if it fits well or requires changes. For a newer setup, choose the software wisely and then plan the landscape. But remember, the software you choose defines this landscape and should be thoroughly checked to avoid any unwanted changes in the future.
3. The load of migration

Data is the basis for every industry functioning in this day and age. Introducing newer software to the system means adding your current data to it for validation and future operations. Check the requirements of the new system you plan on incorporating and if the required is way too much. Remember data is imperative to the organization and correct migration will minimize errors.
4. What the vendor has to offer
Sometime Enterprise Software vendors are too enthusiastic to sell the product but lack a structure post-purchase. Figure out what are the key support promises that they offer and if they have a track of delivering them. A due diligence of the provider should not be skipped especially if the vendor is not a big company.
5. Readying the team

Internal challenges are one of the key points to consider for the purchase. You will have to understand the requirements of the enterprise software development company well along with the features required. Each department will offer a different list of features they need. The challenge is to create a project scope that encapsulates all these important points and uses it as a foundation to identify the right software.
6. Software scope
Considering any enterprise software, and its capabilities, it is quite hard to find one that has everything that a business needs. As organizations strive to meet individual customer demands, they rely on customization to align their strategic objectives with enterprise solutions. For instance, one of our leading real estate organizations wanted to add a document management function that enabled them to share documents easily with their field agents. However, this posed numerous regulatory constraints considering security and privacy. Our solutions experts realigned the software architecture and build processes to meet the client’s requirement.
7. Taking unwanted risks

The market has opened up for Enterprise Software like never before and every day a new solution surfaces that promises to offer the best of all worlds. New-age technology can be highly enticing but always look under the hood and see if it has been taken for a test drive. Check LinkedIn, job boards, or other forums to find out more about the seller and the software itself. Don’t elevate your risks by getting attracted to high-end technology or pricing.
8. No detailed analysis
One of the issues that hamper the procurement of the right enterprise software is the lack of understanding of your own system. Run the analysis several times and match it with what the software will provide. Keep in mind to not depend on what the next version update will feature, rely only on what the solution provides today.
9. Cutting the influences

Decision making in organizations sometimes doesn’t necessarily stay with the designated employees. It is directly or indirectly influenced by the owners or other people in important positions. No matter how well they know or what better deal is offered through a reference, ensure that the decision, in the end, comes keeping the organization in mind and not the influences.
10. Exploring all opportunities
Do not hesitate to look at third-party support alternatives as they might offer something similar or better than premium vendor support. Look at the maintenance rates that come with the software as it is something that your organization will incur on a regular basis.
Whether you are trying to set up a new system or replace an old one, an expert perspective can help reduce these risks and challenges.
Stay up to date on what's new
About the Author

Featured Blogs
Stay up to date on
what's new
Talk To Our Experts
There is no information that is not available on the internet today. Digitally, the world has grown into one big continent. Digital presence has become vital for every business, small or large. The times that you only depend on an offline marketing campaign or connection is gone. Today, more than 80 % of users go online and search for things. Even if they zero in on a product, they still will research the product or the brand online. In such a situation, a business that doesn’t have a strong presence online will suffer. Business growth can be directly related to promotions, public relations, advertising, and sales. Let us see how getting a digital presence will boost your business –
1. Provide information

A business with a decent website offering all necessary information that users seek is a good start. Even if you run an offline business, customers will seek online information to know about you even before walking into your office.
2. Get more customers
The digital world is a great place to find potential customers who might be interested in what you are selling. Social Media is a good place to begin campaigns that are not necessarily direct marketing. Spread the word with hashtags and keywords. Your current customers will share your posts and turn into indirect marketers as well. These platforms provide a boost to your visibility and provide the right traffic your business requires.
3. Be visible

When your business has been tuned with Search Engine Optimization (SEO) elements, you will start getting more and more traction. The right type of optimization will ensure that you end up as a top search whenever a customer is looking for a relevant product or service that you are offering. Also, it helps you get an edge over other competitions, both offline and online since your name will come to the front and grab more eyeballs.
4. Market your business
Advertising your business is the sole way to boost your sales and nothing works as good as digital marketing in this day and age. Apart from having a presence on social media websites, targeted marketing campaigns on these sites will spread awareness about your products and services team with great offers to attract customers.
5. Improve Services

Digital presence of your business provides you with an opportunity to directly interact with your customers. Listen to their grievances, feedbacks, and even offer a solution for their problems. This feedback pattern can help you decide on improving your products or services. Companies can consider some of these points as a part of their marketing strategies to bounce back or to adopt what way to go forward. Such a medium works perfectly well for your business as well as your customers. To increase visibility and drive new business, companies create custom business solutions to advertise online.
6. Global Presence
If your business is local and has an aspiration to go global, the digital world is the right place to put your foot forward. It helps in not just connecting with people worldwide but also getting yourself known to everyone. You can add posts on social media websites regarding your services and add a survey to know if they would like these products or services in their locality. It’s a great way to know the potential of a market even before you actually start the ground activity. Businesses that are looking for investments can also leverage on this very presence as one of their key strengths.
A great way to add a digital presence to your business is seeking the help of an experienced digital partner who can provide you with all the necessary tools to get you started and then skyrocket your business ahead.
Stay up to date on what's new
About the Author
Featured Blogs
Stay up to date on
what's new
Talk To Our Experts
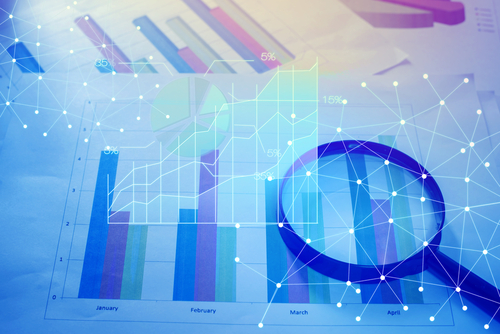
Data visualization, in its simplest form, is the representation of information in charts, diagrams, pictures, and other two or three dimensional images. The concept has assumed critical dimensions in today’s information-heavy age, where businesses increasingly rely on actionable insights derived from big data.
Today, powerful tools that crunch raw data and deliver it in the required form, makes the task of data visualization easy. However, even the best of tools are not sacrosanct. Each tool comes with its own set of strong points and limitations. Here is a rundown of the top data visualization tools, used by business managers and other stakeholders to make informed decisions.
Tableau
The Tableau data visualization tool offers some powerful features, including the ability to merge any kind of data with the existing data set, taking analysis to whole new levels. The tool offers an intuitive drag-and-drop feature, making the task of visualization in the required format a breeze. Tableau is rated highly across the board, and anyone, across functions, roles, or industry can easily customize it according to their requirements. Another big plus for Tableau is its robust mobile client, allowing executives to generate highly intuitive visualizations on the move. The free cloud-based version is especially useful for startups and small businesses. The seamless integration with most data types and out-of-the-box integration with most popular Big Data platforms, including Hadoop, is another advantage of Tableau.
Nevertheless, the lack of machine learning algorithms is a big limitation. This means the tool lacks features such as decision trees, CHAID analysis, and K-means. Users requiring such features need to implement the same using R, SPSS Modeler, or Python. The workflow could be smoother, with many dashboard filters remaining convoluted. The range of options in the Histories section is pretty limited. There is no formatting option for individual filters either. Also, the tool is costly for all the features on offer, and leveraging all the features requires sound technical expertise.
Sisense
Sisense scores high in ease-of-use and speed. It is deployable easily and operable even by lay users, without any technical expertise. T he easy nature, combined with real-time analysis capabilities of the tool makes it ideal for business managers who may change their minds frequently, depending on business exigency and the extremely fluid external environment. Static dashboards are passé, and dynamic dashboards that reflect the changed realities of the moment are the order of the day. Sisense caters to this need perfectly, allowing business managers and marketers to create charts and graphs on the fly, when in business meetings or elsewhere. The dashboard aggregates data from multiple data sources at high speeds and also connects smoothly to all data platforms. The HTML5 interface adds to the neatness and simplicity of the tool, without compromising on its power in any way. The flexible pricing plans on offer are another plus.
Nevertheless, there is scope for improvement. The limited export functionality, the convoluted drill-down capabilities, and lack of any out-of-the-box visualization features are some limitations.
Dundas BI
 Dundas BI scores over many other visualization tools in its offering version control, or the ability to roll backward and forward from the dashboard, easily. The easy drag and drop functionality allow users to drop an Excel file and create a data source from it on-the-fly.
Dundas BI is an end-to-end solution, combining simplicity and power. It offers ETL, reporting and dashboard capabilities in a single platform, However, there is still scope for additional functionality. Two glaring limitations are the lack of funnel charts in visualization options and absence of a default a data grid to be collapsed by groups.
Qlik Sense
Qlik Sense scores high on ease of use and flexibility. It offers a robust set of tools to create highly advanced and customized dashboard panels and visualizations, and also add customized graphics, without a single line of code. It offers an intuitive memory tool that generates so lid information, with the possibility of generating in-memory insights using self-service data connections with any database. Qlik Sense’s advanced query-based tools allow users to uncover patterns and relationships across various sources, with considerable ease.
There is, however, a serious limitation of being able to store data results only to a proprietary file, and no other tool, outside of Qlik, can read these files. The flexibility on offer also increases complexity for new users and requires technical expertise to realize.
SAP Lumira
 SAP Lumeria is one of the most powerful tools available in the market, enabling mining and manipulating data in a wide variety of ways. Business executives and data managers may create stories with their data, leading to powerful insights not easily discernable otherwise. For instance, marketers could show the sales across territories and see which ones were performing better than other ones. The tool also facilitates creating dynamic dashboards, and deep visualization capabilities, both customized to the hilt. The charts, graphs, maps and other visualizations on offer integrate seamlessly with third-party APIs. SAP Lumeria can connect easily with any data source.
However, what SAP Lumeria scores on functionality, it lacks in grace. The tool is a bit cumbersome, and not entirely free of bugs. The tool is still in an early stage, so more features and functionality are in the offering, in the coming months.
No data visualization tool is equal. While dashboard customization, data analysis capabilities, and ease of use are the basic functionality expected in the top data visualization tools, beyond such basic functionality, each tool comes with its own set of strong points and limitations. There is, however, no good or bad tool, and the best tool depends on the specific need of the enterprise. Enterprises may do well to create their own custom data visualization tools, attuned to their specific requirements. With our resourceful and experienced team, backed by implementing several cutting-edge projects cutting across industries, we are best placed to partner you in this regard.
Stay up to date on what's new
About the Author
Featured Blogs
Stay up to date on
what's new
Talk To Our Experts
Traditional dashboards, by definition, were meant to provide an “at-a-glance” view of the state of affairs of a business. As a matter of fact, there were web analytics experts who asserted that a dashboard that does not fit in a single page were not dashboards at all and that they were just reports.
According to Avinash Kaushik, Digital Marketing Evangelist at Google, “If your dashboard does not fit on one page, you have a report, not a dashboard…..This rule is important because it encourages rigorous thought to be applied in selecting the golden dashboard metric.”
Now, if this was just one of the few constraints that applied to the conventional belief in one-page dashboards, it would have been a different scenario. But referring to a constraint, as a rule, leads to the assumption that there is only one possible means to achieve the results. I find that it limits the scope of a dashboard and thus affects the effectiveness.
THE TRANSITION
Given that the purpose of a dashboard is to give an accurate, concise and effective description of what the users want to see, limiting it to pages or screens did not seem to be the brightest of ideas. And apparently, this was not just what I thought. As time flew, and as technology conquered whole new levels, people slowly realized the paradox – In the age of touch screens and interactive user interfaces, having single page dashboards is like owning the old heavy and fist-thick mobile phones in place of smartphones.
Not that the old dashboards did not serve the intended purpose at all. They did justice to what they had to represent in those times. But now, with the changes in technology and data and analytics, we are forced to move away from such principles for a number of reasons.
WHAT LED TO THE PHASING OUT OF ONE-PAGE DASHBOARDS?
One of the major reasons why dashboards longer than a page were considered to be sins was the grudge against “scrolling”. How can we possibly ask them to scroll or navigate when they are looking for information “at a glance”?
But now, with touch screens and gestures, navigation, on the whole, let alone scrolling has become easy as ever. Such kinds of interaction methods have actually extended what users used to consider as single screens. There are many marketing sites as well these days, that make use of vertical scrolling for navigation and have immense traffic. It also shows how people have changed and got accustomed to new ways of technology.
Interactive interfaces
Earlier (much earlier), dashboards were mere static documents with a high-level overview of the data with no chance for the users to interact with it. Then came a little more sophistication with spreadsheet software, having advanced features to make dashboards interactive. Again, there were limitations. So the basic idea of interacting with the data, and being able to extract desired specific information, led to the expansion of the scope of dashboards and without much thought, one-page dashboards can be put out of the picture.
Only the specifics
As is the case with most people these days, lack of time and attention span, limit their ability to view and understand things properly. With smartphones, tablets, and smartwatches, people are seeking only the most relevant information and that’s what they deliver. Only specific or the most critical information is delivered and the rest is only given as a choice (on request). This new ask-and-get mode of information exchange does not really fit well with one-page dashboards. We cannot expect people living in this age to analyze data from a single page, crammed with data, figures and illustrations.
Even with all the technological influences, the purpose of dashboards remains the same – to show the big picture in the easiest, most comprehensive way possible. And today’s technology is a great means to achieve that goal. Dashboards today, do more than just providing insights. They also guide the users through the data and help in making actionable decisions. Single-page dashboards, cannot do any of these and are hence phased out!
Stay up to date on what's new
About the Author
Featured Blogs
Stay up to date on
what's new
Talk To Our Experts
Data visualization and dashboards. The perfect means for communicating ideas and complicated information easily. However difficult it is to explain your ideas, if you use interesting and interactive graphics for it with the help of user-friendly data visualization tools, you can create beautiful presentations and put forth your thoughts easily. But is just making interesting dashboards enough, to make your audience understand and engage with your content?
Along with putting a lot of thought into making graphical presentations, you also need to spend time on getting it across to your audience. It’s a combination of strategies while making presentations as well as marketing them, that make them effective. Here are some quick tips on how to make your dashboards or presentations go viral:
While creating them…
- The right data – While creating your presentations, take a little bit of effort to do research and find out what your target audience is like, and what they might find interesting. For example, if you have numbers, create a context with which the target audience can relate rather than simply giving out the numbers.
- The right graphics – As an extension of the previous tip, the research will do good in case of graphics as well. For example, whether to use complex charts or simple infographics.
- A good story – The data in your presentations can be made more effective if presented in the form of a narrative. The story supported by the numbers will be perfect for emotionally appealing with the audience.
- Interactivity – One of the best ways to engage with your audience is to make your charts interactive. Average charts are no more in the picture these days. You can make your presentation stand out if you make them feel that they are personally part of the discussion.
- Data accuracy – It goes without saying how important it is to present accurate and reliable data to the audience. If by any chance they feel that your data is not credible or unreliable, then they might not come back to you.
While marketing them….
- Buy-ins – Make sure that you display the apt Key Performance Indicators (KPIs) and gain buy-ins from the audience. This is significant from a future perspective as well, as the value of your data will spread around through word-of-mouth, when people discuss your presentation.
- Use social media platforms – Using social media platforms such as Facebook and Twitter, and also the corporate versions of these like, SalesForce Chatter to push your content is a very effective strategy. You can create groups in these channels and post regular updates to keep your audience engaged.
- Round-the-clock accessibility – Make your content accessible from anywhere, from any device and at anytime. The audience should be able to get to your data in a few seconds and with just a few clicks. Or else, you are likely to lose them.
- Fast loading – Just like being able to access your data in seconds, it is also important that you make sure your content page loads quickly. It also shouldn’t crash after a while. These are some of the major reasons why people quit a page or an app.
- Internet platforms – Just like social networking sites, there are many platforms or forums on the internet where you can go live and post your content. Being live, it enables fast responses and results.
Apart from these if you do sufficient research, you will be able to find places where data enthusiasts often meet or discuss data relevant to your business. You can use those channels as well to push out your content.
Data visualization is undoubtedly one of the most effective ways to reach out to your clients or customers. If done properly, with the right tools and in the right methods, it will improve your efficiency and reliability by a large margin. Are you looking to create leverage data visualization for your business challenges? We can help you with it!
Stay up to date on what's new
About the Author
Featured Blogs
Stay up to date on
what's new
Talk To Our Experts
As technology adoption grows globally, data is being generated by enterprises and consumers alike. By 2020, it is predicted that the annual volume of data will increase by a staggering 4300%. For corporations, the key to success will be in making use of this data to derive meaningful business insights, especially by using technology.
Here, we focus on one such organization – Premium Retail, whom Fingent has helped in reducing costs and increasing sales and overall efficiency. Fingent deployed an advanced data analytics and data visualization solutions making use of Premium retail’s data.
Premium Retail Services (PRS) Inc. based in Missouri, is a company that has provided comprehensive retailing solutions for over 25 years for companies like Procter and Gamble, Walmart and Best Buy. Their services include merchandising, assisted sales and training, field marketing etc.
The challenge
When Samsung retained PRS to provide comprehensive field marketing services on its behalf in the US market, it needed to deliver a wide range of capabilities pretty quickly. PRS began by assigning Field Marketing Representatives (FMR) to carry out essential activities across the US. The data associated with this assignment alone was extensive. PRS accesses information on more than 12 vertical retail segments that produce close to 1,000,000 data points per month. Now, PRS realized that this data was a treasure trove of business and consumer insights. However, its ability to use the data for informed decision making and guide assessments was hampered by its existing data management capabilities. Moreover, it used obsolete communication and reporting systems that relied heavily on excessive amounts of powerpoint and excel files. It took a long time to process and it was outdated.
How Fingent helped
Data analytics and data visualization are trusted methods to simplify complex information. Considering the variety, volume and velocity of data involved in PRS’s reporting, Fingent proposed to use these methods to create a solution that would reduce human efforts while increasing data accuracy, clarity and credibility.
After completing an inventory of the PRS systems, Fingent developed a plan to transform an approach that produced extensive amounts of unstructured and complicated data from many obsolete, single-window applications into an integrated and better-organized solution. Fingent found it essential to identify the data touchpoints and create scalable solutions, with automated responses that helped PRS to efficiently produce customized, comprehensible reports.
The different technologies used were as follows:
Programming languages – HTML, PHP, JS
Visualization libraries – d3.js, dc.js
Databases – MySQL, Apache
The impact
PRS, through the customized web application that Fingent created, was able to efficiently convert large volumes of data into user-friendly visual representations. This enabled easy analysis of data in different permutations. The data was presented through interactive displays of charts, tables and graphs that highlight what is significant.
This application helped PRS to manage its field marketing personnel by letting managers easily bring performance metrics into the reporting tools they already had. Moreover, the users were able to customize how information was presented to them in a personalized dashboard according to region, role, department or other attributes.
The benefits that PRS derived from this application include:
- High-quality data – Through rigorous analytics, PRS was able to achieve high-quality data, reduce errors and improve consistency
Refined business processes – Through pattern analysis issues can be identified and solved in real time - Bringing out significant insights – Through identification of trends and patterns, significant insights are brought out improving data transparency and accountability
- Easy data management – Time spent on data management is significantly reduced as have related costs. System reliability is improved
On the whole, with the custom web application developed by Fingent, PRS was able to reduce the human efforts involved in analyzing the enormous volumes of data that PRS managers received on a daily basis. It also helped PRS to restructure its business process into a more viable and effective model which has significantly increased its revenue generating capacity.
Stay up to date on what's new
About the Author
Featured Blogs
Stay up to date on
what's new

