Business Intelligence 101
What is Business Intelligence?
Business Intelligence (BI) turns data into information. It is the sum of applications, technologies, and methods adopted to glean strategically relevant information for the business. The task involves collecting, integrating, analyzing, and applying historical, current and predictive information related to the business. The objective is to gain strategic insights, evaluate risk, and improve decision-making capabilities for top management, business owners, and other stakeholders.
Business intelligence information encompasses both internal data and external data related to the business. Internal data may include operational data, data from sales, financial data, and more. External information is fairly wide in scope and may include information from the external supply chain, social media channels and more. Another dimension to external information for business intelligence is information about competitors and other companies, for benchmarking, and to gain a competitive edge over such companies.
Many businesses now apply business intelligence to make informed decisions, rather than relying on hunches or unfounded assumptions. For instance, restaurant owners use business intelligence to decide the menu to be added and removed from a restaurant menu. Automobile manufacturers apply business intelligence to add new features to their car models. Tour operators use business intelligence to optimize their itinerary. The possibilities are endless. Businesses may use Business intelligence to modify their internal work processes as well.
Business Intelligence Vs. Analytics
One might mistake Business Intelligence as being another name for the much-hackneyed business analytics. While both business intelligence and analytics involve aggregating and analyzing data, the similarity ends there.
Business intelligence aggregates data to make it explicit what is happening to the business, whereas analytics aggregate data to delve into why it happens. For instance, business intelligence evaluates sales performance by extracting data from various sources and presenting it in the form of intuitive graphs. Analytics involves running statistical tests to make explicit whether sales performance correlates with advertisements and promotions undertaken.
While both business intelligence and analytics involve analysis of data, the scope is markedly different. In a sense, Business Intelligence ends with the basic mathematical operations of addition, averages, and percentages to the dataset. Applying advanced algorithms complex formulas, statistical operations such as regression analysis, correlation analysis, and more, to answer deeper questions related to the dataset comes from the realm of analytics.
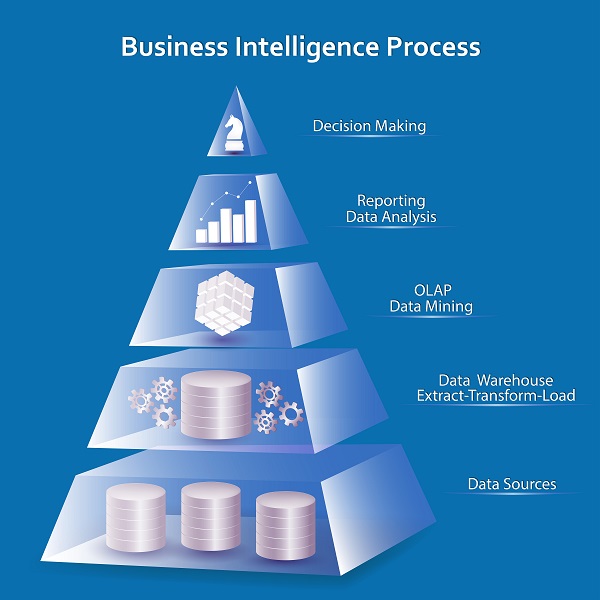
Technically, Business Intelligence encompasses ETL tools to access and transform data, OLAP (online analytical processing) tools to handle complex queries, tools to manage metadata, development tools to generate various reports and dashboards, and others tools for publishing, scheduling and distribution capabilities. Analytics co-opt different methods of analyzing information, such as descriptive, predictive, regression, neural networks, and the tools to apply such methods.
What is a Business Intelligence Software?
Business intelligence software enables enterprises to undertake business intelligence tasks.
Any Business Intelligence system worth its byte involves the following activities, and software to undertake such activity.
- Data warehousing, or bringing together all data, such as sales data, operational data, data from financial reports, competitor sales data, social media talk, and more. ETL (extract-transform-load) tools usually facilitate the task of extracting data from several databases, systems, and applications, transforming it as required, and loading it into the target data warehouses, analytical applications, and other systems.
- Data visualization, or presenting the information in a visually appealing way, for users to make sense of the data in a better way. There are different visualization types, such as charts, graphs, infographics, and more, and various enabling tools for each type. Each visualization type serves a specific purpose. For example, Pie charts are best suited to communicate relative performance, whereas bar charts depict trends in the best way. Some intuitive methods such as “slice and dice” are gaining popularity of late, for its powerful capabilities.
- Management dashboards, or well-grouped set of visualizations containing most relevant information to any stakeholders, usually reserved for top management. OLAP tools, used to aggregate data and handle complex queries, are commonly associated with Business Intelligence
Several types of tools enable data visualization and management dashboard capabilities.

- Spreadsheets such as MS-Excel are the most common method of presenting the Business Intelligence data. The ease of work nature and universal availability of spreadsheets are however marred by serious limitations, such as limited security, limited collaboration features, limited automation capabilities, and a high degree of inaccuracy and variability. Various other tools offer seamless and advanced automation, security, and audit capabilities, which MS-Excel lacks.
- Operational reports, often custom made for the enterprise, list data at a very detailed level, in a highly-structured and logical format.
- Querying and analysis solutions allow business users and analysts to generate business queries and reports rapidly. The ad-hoc nature of these tools offers unbridled flexibility. These tools also come with intuitive graphical interfaces. A middleware layer which converts database conventions to normal business nomenclature, and dashboard drag-and-drop functionality spares end-users from the need for technical proficiency to use these tools.
- Dashboard management systems offer easy access to key information in intuitive and graphical formats. It displays the required set of key performance indicators, metrics, and other relevant information in a single consolidated view, greatly improving the user’s decision-making capabilities.
- Data mining tools allow analyzing large data sets to discover patterns and build predictive models. data mining application use algorithms, statistics, advanced mathematical techniques, and sophisticated data search capabilities, to unearth insights otherwise not discoverable.
- Online analytical processing (OLAP) tools facilitate the rapid visualization and analysis of business metrics. Users may store and access data in multidimensional OLAP cubes comprising of measures, and text values. Queries from OLAP cubes are much more powerful than simple database tables and offer users advanced insights into past performance and various “what-if” scenarios. Users may use such cues to evaluate information from various dimensions and perspectives. In fact, OLAP operations constitute the fundamentals of most advanced functionality used by data visualization tools.
Top Business Intelligence Tools 2017

Until a few years ago, users had a limited choice of comprehensive Business Intelligence tools. The choice was limited to platforms offered by biggies, such as IBM, Oracle, SAP or Microsoft. The high cost of the software and the associated complexities made business intelligence out of the reach of most enterprises, except big corporations.
The advent of the cloud changed things, making business intelligence more democratic. Business no longer needed to build their own BI infrastructure in-house, as SaaS providers perform the resource-intensive tasks of data gathering, persisting and reporting, allowing businesses the ease, affordability, and convenience of the subscription model.
Some of the top ETL tools include Oracle Warehouse Builder, SAP Database Services, IBM Infosphere Information Services, SAS Data Management., Elixir Repertoire for Data ETL, SQL Server Integration Services (SSIS), and more.
Some of the top OLAP tools in vogue include Yellowfin, Stratum, Birst, Profitbase BI, and the quintessential Microsoft SharePoint, among others.
Here is a rundown of some of the leading data visualization and dashboard software in 2017
- Dundas BI, one of the most popular browser-based business intelligence and data visualization platform, offers integrated dashboards, reporting tools, and data analytics capabilities.
- Domo, A cloud-based suite, makes it easy to integrate multiple data sources, including databases, spreadsheets, social media and also legacy cloud-based and on-premise solutions deployed in the enterprise.
- SiSense support business data with powerful visuals and tools, making it handy for users with little or no technical skills.
- BOARD, a centralized tool, hosts data and conducts multidimensional analyses. It boasts an impressive client list, which includes US Navy, Giorgio Armani, and Puma, among others.
- IntelliFront BI enables viewing multiple data sets from a single pane. It also distinguishes itself with strong automation features, real-time dashboards, and on-demand reporting.
Self Service Tools
The emerging trend of self-service business intelligence, made possible by the advancement of mobility, analytics, and other relevant technology, empower end-users with the ability to undertake business intelligence tasks by themselves, without necessarily having advanced technical skills.

As it is with several other sectors, Google has also entered the business intelligence space, and with time, is sure to give established incumbents a run for their money. It is now possible to build an intuitive BI dashboard powered by Google Data Studio reporting tool and Google BigQuery, a cloud-native data warehouse capable of analyzing petabytes of data in double quick time. As always, all these Google tools are open-source and free, giving developers the unbridled freedom to co-opt it in their systems, the way they want it.
Google’s new offering competes with Microsoft Power BI, another free, self-service cloud-based business intelligence offering from the Microsoft staple. Non-technical users may leverage this offering for aggregating, analyzing, visualizing and sharing data easily.
Businesses would do well to consider developing custom suites facilitating such self-service options, integrating ready-to-use Business Intelligence tools to the extent required. Partnering with a competent IT software solutions provider would enable the business to roll out highly intuitive business intelligence apps and other solutions, empowering end-users to gain the required insights easy and fast, without having to wait for the IT team to do the job and spoon-feed them with reports.
Stay up to date on what's new

About the Author

Recommended Posts

25 Jun 2024 Financial Services B2B
Business Intelligence in Financial Services: Unlocking Data-Driven Success
Business Intelligence in Financial Services is proving to be a game changer. Business intelligence is a novel technology backed by AI. It is a combination of strategies and processes. Simply……

25 Jul 2023 B2B
A Quick Guide To A Successful Digital Transformation Journey!
Today, technology seamlessly weaves its way into every aspect of our daily lives. That's precisely what digital transformation is all about - a process that enables businesses to harness the……

11 Aug 2021 Financial Services
7 Ways Business Intelligence In Finance Can Empower CFOs Today
Business Intelligence in Finance becomes the most trusted aide of the modern CFO. Here's how BI helps finance teams to leverage insights and drive the business forward. Business Intelligence In……

04 Jun 2021
Business Intelligence in SAP: How It Helps You Become a Data-driven Organization
How Business Intelligence in SAP Helps You Become a Data-driven Organization Business Intelligence is the data powerhouse essential for the survival of your business. BI can help organizations evaluate and……
Featured Blogs


Stay up to date on
what's new


