How Data Warehousing Adds Value To Data Visualization & Reporting
Can Data Warehousing Enhance the Value of Data Visualization & Reporting?
Organizations rely heavily on data to make crucial business decisions. Hence, it is important for your business to have access to relevant data. That is where a well-designed data warehousing comes to your rescue!
Besides gaining actionable insights, corporate executives, business managers, and other end-users make more informed business decisions based on historical data.
Today’s Analytics and Business Intelligence solutions provide the ability to:
- Optimize business processes within your organization
- Increase your operational efficiency
- Identify market trends
- Drive new revenues
- Forecast future probabilities and trends
Before understanding how data warehousing can add more value to data visualization and reporting, let’s take a look at what these terms mean.
Analytics and Business Intelligence
Business Intelligence is a process that includes the tools and technologies to convert data from operational systems into a meaningful and useful format. This helps organizations analyze and develop meaningful insights to take timely business decisions. The information derived from these tools demonstrate the root cause of your business problems and allow decision-makers to strategize their plans based on the analysis.
Business Intelligence is information not just derived from a single place, but multiple locations and sources. It can be a combination of the external data derived from the market and the financial and operational data of an organization that is meaningfully applied to create the “intelligence”.
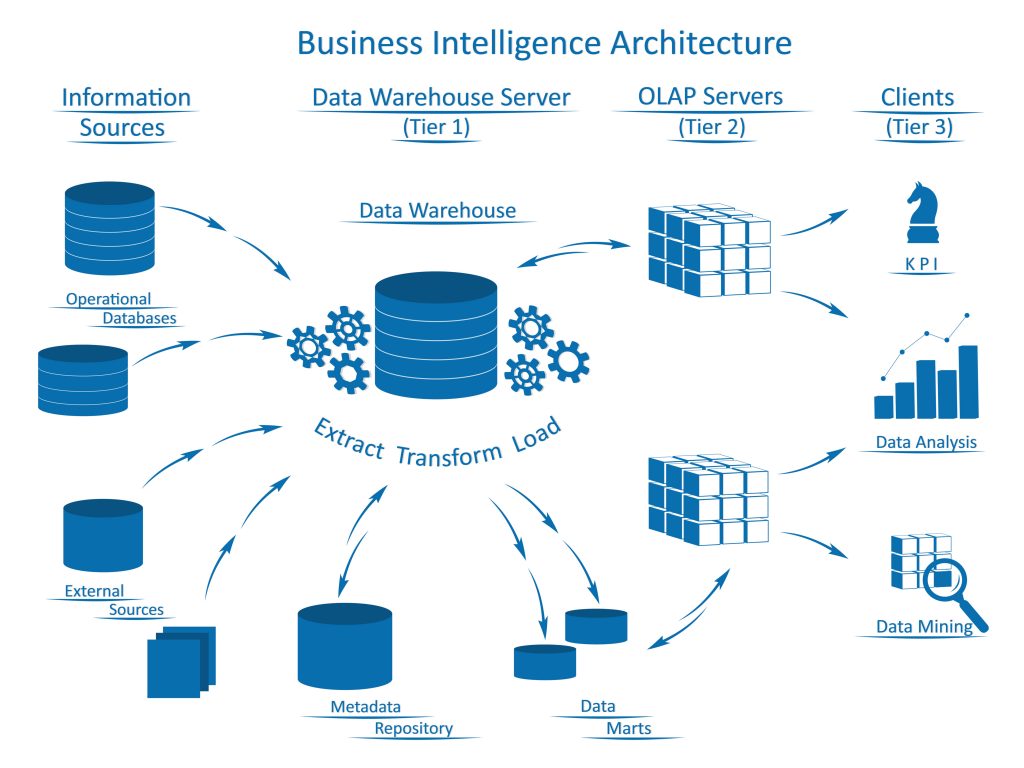
Data Warehouse
Data warehouse is a repository that collects data from various data sources of an organization and arranges it into a structured format. An ideal data warehouse set up will extract, organize, and aggregate data for efficient comparison and analysis. Data warehouse supports organizations in reporting and data analysis by analyzing their current and historical data. This makes it a core component of Business Intelligence.
Unlike a database, that stores data within, at a fully normalized or third normal form (3NF), a data warehouse keeps the data in a denormalized form. It means that data is converted to 2NF from 3NF and hence, is called Big Data.
Key benefits of a Data Warehouse
- Combine data from heterogeneous systems
- Optimized for decision support applications
- Storage of historical and current data
Why We Need Data Warehouse for Business Intelligence?
Before the business intelligence approach came into use, companies used to analyze their business operations using decision support applications connected to their Online Transaction Systems (OLTP). Queries or reports were retrieved directly from these systems.
However, this approach was not ideal due to:
- Quality issues
- Reports and queries were affecting business transaction performance
- Data resides in heterogeneous sources
- Non-availability of historical data
- Non-availability of data in the exact form required for reporting
Connecting your organization’s business intelligence tools to a data warehouse can provide you benefits in terms of production, transportation, and sale of products.
Data Visualization vs. Data Analytics – What’s the Difference?
Data Warehousing and Business Intelligence Using AWS
Today, traditional BI has given way to agile BI where agile software development accelerates business intelligence for faster results and more adaptability. Big Data is growing fast to provide useful insights for making improved business decisions.
There has been a paradigm shift in data storage with warehousing solutions moving increasingly to the cloud. Amazon Redshift, for instance, is one of the most popular cloud services from Amazon Web Services (AWS). Redshift is a fully-managed analytical data warehouse on cloud, that can handle petabyte-scale data, which enables analysts to process queries in seconds.
Redshift offers several advantages over traditional data warehouses. It provides high scalability using Amazon’s cloud infrastructure to set-up and for maintenance, without the need for upfront payments. You can either add nodes to a Redshift cluster or create additional Redshift clusters to support your scalability needs.
You can use AWS Marketplace ISV Solutions for Data Visualization, Reporting, and Analysis.
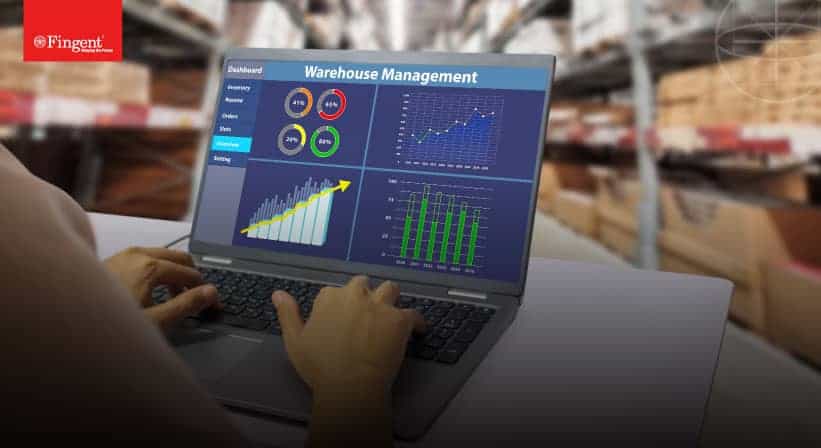
Data visualization helps you identify areas that need attention or improvement, clarify factors that influence business such as customer behavior, and making decisions such as finding out a suitable market for your product or predicting your sales volumes, and much more.
TIBCO Jaspersoft, for example, is a solution that delivers embedded BI, production reporting, and self-service reporting for your Amazon data at affordable rates. It features the ability to auto-detect and quickly connect to Amazon RDS and Amazon Redshift. Jaspersoft is available in the AWS Marketplace in both single-tenant and multi-tenant versions. TIBCO Jaspersoft for AWS includes the ability to launch in a high availability cluster (HA) as well as with Amazon RDS as a fault-tolerant repository. Pricing is based on the Amazon EC2 instance, type as well as the chosen single or multi-tenant mode.
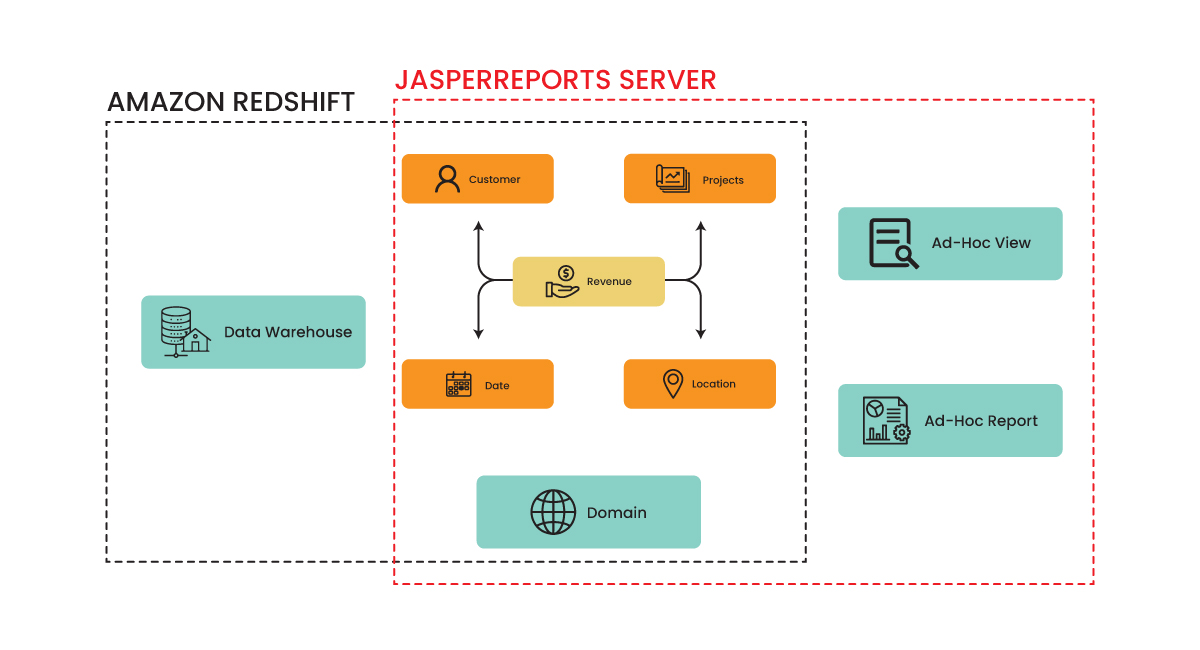 Image source: http://bit.ly/2IWWCDn
Summary
By moving your analytics and business intelligence to a hybrid cloud architecture you will be able to handle huge amounts of data and scale at the rate of expansion required by your business. You will also be able to deliver information and solutions at the speed that your employees and customers demand, and gain insights that will enable your organization to innovate faster than ever.
Business Intelligence and Data Warehousing are two important aspects of the survival of any business. These technologies give accurate, comprehensive, integrated, and up-to-date information on the current enterprise scenario which allows you to take the required steps and make crucial decisions for your company’s growth. To know how your business can benefit from the latest technologies, get in touch with our experts today
Stay up to date on what's new

About the Author

Recommended Posts
25 Jun 2024 Financial Services B2B
Business Intelligence in Financial Services: Unlocking Data-Driven Success
Business Intelligence in Financial Services is proving to be a game changer. Business intelligence is a novel technology backed by AI. It is a combination of strategies and processes. Simply……

25 Jul 2023 B2B
A Quick Guide To A Successful Digital Transformation Journey!
Today, technology seamlessly weaves its way into every aspect of our daily lives. That's precisely what digital transformation is all about - a process that enables businesses to harness the……
28 Apr 2023 B2B
Utilizing SAP Analytics Tools to Turn Your Data Into Valuable Insights!
SAP is widely known for its brilliant abilities and functionalities, the foremost being Data Analysis. The newest version of SAP ERP is the SAP Data and Analytics Solution. It has……
18 Feb 2022 B2B
Top 10 Data and Analytics Trends Ruling the Roost in 2022
Over 95% of businesses struggle to manage unstructured data in their day-to-day operations. Inability to decipher data prevents them from navigating the market successfully, making business forecasts, and customizing their……
Featured Blogs


Stay up to date on
what's new


