Data Visualization vs. Data Analytics – What’s the Difference?
With data now being a critical source of competitive advantage, enterprises are cutting across size and geographies seeking newer methods to identify and analyze the data they generate.
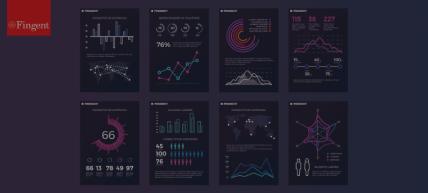
With data now being a critical source of competitive advantage, enterprises are cutting across size and geographies seeking newer methods to identify and analyze the data they generate.

From snake oil peddlers to the thirty-minute infomercial, we’ve seen it all when it comes to sales techniques. One thing is certain, though. Today’s consumers will not respond to “old school” sales practices. No longer will a “one-size-fits-all” sales approach work.
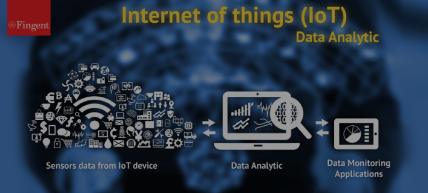
IoT and data remain intrinsically linked together. Data consumed and produced keeps growing at an ever expanding rate. This influx of data is fueling widespread IoT adoption as there will be nearly 30.73 billion IoT connected devices by 2020.