Category: Analytics
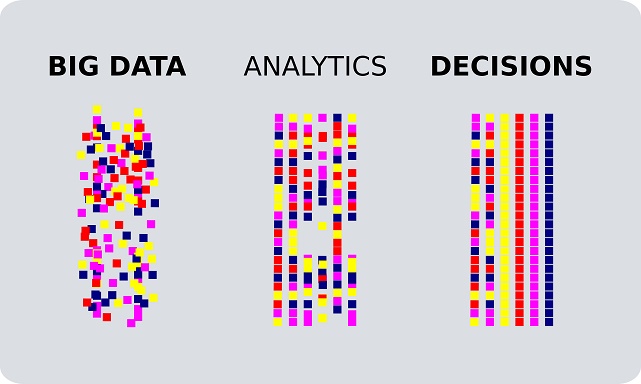
Big data has come a long way in 2016, but there is scope for much more. Here are the top big data trends, or how enterprises would leverage big data in new and innovative ways, going forward.
1. Dominance of the Cloud
The spread of the cloud notwithstanding, many small and medium enterprises still rely on on-premises data centers. As such legacy data centers reach their end of life, and as the benefits of the cloud become too tempting to ignore, there will be an increased migration to the cloud.

The future of big data for the enterprise is in the cloud, considering the infinite power and flexibility on offer. The cloud enables enterprises to tap into the required resources with a few mouse clicks, without having to take the trouble for provisioning, or seek talent to run in-house Hadoop clusters and processing. The migration to the cloud also cut costs in maintenance and operations.
2. Incorporation of Live IoT Data
The Internet of Things is in the throes of effecting a paradigm shift in all things computing. If anything, it will enrich Big Data analytics with even more data. With IoT gaining center stage, the focus of Big Data for the enterprise will shift to processing real-time and actionable data derived from IoT sensors and other live information, and transmitting the same to users and machines, for actionable information.
Enterprises will be faced with the increasing need to integrate and make sense of data entered by humans and data captured by machines, to aggregate composite visualizations. For instance, data from drones, combined with sensory and standard IT inputs, merged into a single pane of glass view would offer fresh multi-dimensional insights not possible before.
3. The Use of More Dark Data
The spread of computing and the Big Data trend of digitalization has been underway for some time now, but much of enterprise data are still trapped in paper-based documents, paper photos, CD’s, vaults, storage closets, and unconnected hard drives. Such data may be invaluable in offering historical insights and performance trends. Among the key Big Data trends would be demolishing silos that lock up data in the first place, and integrate such trapped data, to ensure comprehensive and complete analysis.
For the enterprise, accessibility and relevance of historic data become even more relevant in today’s hyper-competitive and a cut-throat world, where trademark infringement and/or intellectual property violation claims are manifold.
4. Focus on the Results rather than the Efforts
The proliferation of data makes it important to separate the wheat from the chaff. The terabytes of data being generated from multiple sources can drown even the most efficient of enterprises. To cope with the challenge of crunching terabytes of data, more and more organizations are now adopting Hadoop and other big data stores.
With the focus on results than effort, executives seek out relevant insights. Side by side with a focus on real-time analytics and insights, Big Data analytics will increasingly focus on data and results that really matter and add value to the bottom line, rather than analytics for the sake of it. Big Data vendors are introducing new and innovative Hadoop-based advanced analytic solutions towards this end, and enterprises have no option but to embrace such tools.
5. Immediately Gratifying Analytics
Today’s fast paced world demand instant results, fuelling the demand for real-time analytics capabilities. Today’s business executives demand real-time actionable data, in easy to consume and attractive graphics. The delivery of graphics is likely to become more flexible and innovative and take newer dimensions, such as 3D visualizations, as well.
Enterprises who do not cater to such pressing need face the risk of being left out, as competition becomes increasingly sophisticated and use innovative tools to gain better insights, to convince customers.
6. The Rise of Predictive Analytics
Today’s enterprises are going one step ahead of real time analytics and delving into predictive analysis, to take decisions that contribute to the bottom line.
Big Data providers now offer solutions that crunch historic data to predict events and behaviors, allowing marketers and enterprises to position them to make the kill. Predictive analytics also help in fraud detection and minimize risk exposure, besides, make operations more efficient than ever before.
7. The Rise of Self-Service
In tune with the efficiency-oriented lean philosophy, self-service is setting in even in big data preparation and analytics.
Self-service data preparation tools boost time to value, allowing enterprises unmatched flexibility and also making it easier to include unstructured and semi-structured data in the analytics. It also improves trust and reliability in the data included for analytics, considering end users who deal with the data would know its relevance, for inclusion in analytics. The decreased reliance on technical experts empower end users to no small extent and improve operational efficiency in the process.
Self-service in data analytics plays into the pressing need for customization, further boosting efficiency.
8. Increasing Reliance on Data Virtualization
Today’s data is not just voluminous, but also complex, and unstructured. Big data solutions are increasingly relying on data virtualization to unlock what is hidden within large data sets. Graphic data virtualization especially enable enterprises to retrieve and manipulate data on the fly, regardless of how the data is formatted or where it is located.
Through such virtualization techniques, the enterprise may optimize their business intelligence, and unlock better insights.
9. Stronger Administration of Data Security Permissions
With the trend of moving all data into a single integrated data warehouse and repositories, all users would access the same data, but on a “need basis.” The coming days is likely to see more attention to fortifying access permissions and data security. Creating and or revising data access permissions policies, and implementing technology to monitor and detect potential data exfiltration by users is likely to take center stage in the coming days.
10. Increasing Thrust on Security
Security has always been a pressing issue.The convergence of various big management elements such as data quality, data preparation, and data integration, necessary for big data analytics, the increasing reliance on smart devices for generating data, and the increasing regulations in the wake of high-profile breaches raises the stakes of security higher than ever before.
The ramifications of Big Data breaches will be huge, with potential for serious reputational damage and crippling legal repercussions.
With big data being increasingly used for mission critical applications, the stakes have never been higher. As Big Data is expected to go leap and bounds, it is important for enterprises to stay abreast of the latest developments, to remain on the top of the game. Partnering with us for your Big Data plans offers a safe bet, considering our vast experience and expertise in the field, and our track record of having successful implemented several cutting-edge projects, cutting across industries.
Stay up to date on what's new

About the Author

Featured Blogs


Stay up to date on
what's new


Talk To Our Experts
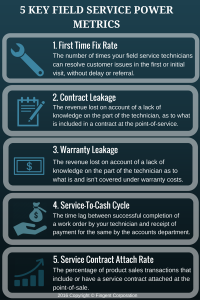
In Field Service industry, where the technicians are face to face with customers everyday, good operational efficiency, productive staff, and effective resource management are all interconnected and are important aspects of the business. Businesses should carefully measure all these areas that indicate the health of their field service. Data and analytics thus recorded, needs to be evaluated to drive more informed business decisions. So, how do you measure these to drive more insights from it?
This photo-blog lists five unique field service power metrics to identify and monitor your company’s performance.
Stay up to date on what's new
About the Author

Featured Blogs
Stay up to date on
what's new
Talk To Our Experts
Traditional dashboards, by definition, were meant to provide an “at-a-glance” view of the state of affairs of a business. As a matter of fact, there were web analytics experts who asserted that a dashboard that does not fit in a single page were not dashboards at all and that they were just reports.
According to Avinash Kaushik, Digital Marketing Evangelist at Google, “If your dashboard does not fit on one page, you have a report, not a dashboard…..This rule is important because it encourages rigorous thought to be applied in selecting the golden dashboard metric.”
Now, if this was just one of the few constraints that applied to the conventional belief in one-page dashboards, it would have been a different scenario. But referring to a constraint, as a rule, leads to the assumption that there is only one possible means to achieve the results. I find that it limits the scope of a dashboard and thus affects the effectiveness.
THE TRANSITION
Given that the purpose of a dashboard is to give an accurate, concise and effective description of what the users want to see, limiting it to pages or screens did not seem to be the brightest of ideas. And apparently, this was not just what I thought. As time flew, and as technology conquered whole new levels, people slowly realized the paradox – In the age of touch screens and interactive user interfaces, having single page dashboards is like owning the old heavy and fist-thick mobile phones in place of smartphones.
Not that the old dashboards did not serve the intended purpose at all. They did justice to what they had to represent in those times. But now, with the changes in technology and data and analytics, we are forced to move away from such principles for a number of reasons.
WHAT LED TO THE PHASING OUT OF ONE-PAGE DASHBOARDS?
One of the major reasons why dashboards longer than a page were considered to be sins was the grudge against “scrolling”. How can we possibly ask them to scroll or navigate when they are looking for information “at a glance”?
But now, with touch screens and gestures, navigation, on the whole, let alone scrolling has become easy as ever. Such kinds of interaction methods have actually extended what users used to consider as single screens. There are many marketing sites as well these days, that make use of vertical scrolling for navigation and have immense traffic. It also shows how people have changed and got accustomed to new ways of technology.
Interactive interfaces
Earlier (much earlier), dashboards were mere static documents with a high-level overview of the data with no chance for the users to interact with it. Then came a little more sophistication with spreadsheet software, having advanced features to make dashboards interactive. Again, there were limitations. So the basic idea of interacting with the data, and being able to extract desired specific information, led to the expansion of the scope of dashboards and without much thought, one-page dashboards can be put out of the picture.
Only the specifics
As is the case with most people these days, lack of time and attention span, limit their ability to view and understand things properly. With smartphones, tablets, and smartwatches, people are seeking only the most relevant information and that’s what they deliver. Only specific or the most critical information is delivered and the rest is only given as a choice (on request). This new ask-and-get mode of information exchange does not really fit well with one-page dashboards. We cannot expect people living in this age to analyze data from a single page, crammed with data, figures and illustrations.
Even with all the technological influences, the purpose of dashboards remains the same – to show the big picture in the easiest, most comprehensive way possible. And today’s technology is a great means to achieve that goal. Dashboards today, do more than just providing insights. They also guide the users through the data and help in making actionable decisions. Single-page dashboards, cannot do any of these and are hence phased out!
Stay up to date on what's new
About the Author
Featured Blogs
Stay up to date on
what's new
Talk To Our Experts
Enterprises today have to deal with a fast paced business environment and truck loads of data coming from all directions. In order to keep up in the race for survival, organizations need to be as agile and alert as possible to overcome the challenges and adapt to the environment. Within the organizations too, data is growing rapidly. With all these complexities, it is necessary for the business managers to make some sense out of the incoming data on time and use it to boost the efficiency of their company.
In other words, the key to the success of any business lies in extracting relevant and actionable insights from the generated data, from anywhere in the world, in an organized and secure manner. It helps managers in making better, more informed decisions and thereby seize every opportunity that may come.
So what can be done to garner such insights? Or rather, what can be used to aid the process of decision making?
The answer is Corporate dashboards. We are all familiar with that term aren’t we? We also know that it is one of the most reliable and effective decision-making tools, as it helps managers get an overall top view of their enterprise by extracting Key Performance Indicators (KPIs). It also enables an easy analysis of the metrics in a user-friendly manner.
Using such dashboards helps organizations improve their efficiency as well as save a lot of time and money. It also adds to the reputation and goodwill of the company as a result. And how?
Before we get into the benefits of using dashboards, let’s see why organizations need dashboards.
Why dashboards?
Every manager in an enterprise, at whatever level of management he may be in, is responsible for decisions concerning his department or division. He has to go through and understand the corporate goals and at the same time manage his own department or team to achieve the goals set for his team. For this purpose, he will have to sift through various spreadsheets, reports and databases across the enterprise to collate information and make the best decision. However, he may not have the time for all this. On top of that, not all users may have access to all the information required to make decisions. These problems may make it difficult for the managers to make decisions.
Dashboards, on the other hand, provide a clear and concise picture of the state of affairs, by integrating data from various sources into a single common platform. It presents such data in the form of insightful graphics, patterns, and the like and also highlights the pain points that require immediate attention.It enables managers to easily make faster and more accurate decisions.
How dashboards save you time, money and reputation
Typically, dashboards offer a number of general benefits such as:
- faster access to information
- ability to generate comprehensive reports
- graphical presentation of real time data
- better visibility into all required departments
- better transparency
- availability of all information in a single place
- insightful illustrations
To discuss how dashboards help in saving time and money, let’s consider a hypothetical situation.
You, being the sales manager of a leading advertising company, are psyched on winning a project with an international client. You are about to reap huge profits and take your company to new heights. On being the sole person creditable for this huge deal, you are required to give a presentation to your team regarding the client and the project. You have prepared your work with the help of presentations and reports and spreadsheets for accounts. Finally, on the day of the presentation, as you stand in front of your team with your laptop, you realize that you haven’t transferred your file from your personal system where you created it. You also find that the spreadsheet that you created does not have a whole page as you forgot to save it…..
The above scenario is the result of using traditional methods of presentation or work. Such spreadsheets and reports create a whole lot of confusion and complexities that you can actually avoid using dashboards. Imagine, having a dashboard that lets you access your client’s information directly in real-time. One that lets you extract specific relevant information in the form of reports on the spot, in case you want to show some financial information.
Dashboards allow you to get all the important information in a single place, rather than through separate files and reports. It thus lets you save a lot of time that you would otherwise have spent on making the presentation with spreadsheets and documents, collating information from various departments etc. It also lets you save money used in buying and maintaining spreadsheet software and in making frequent visits to your client’s site.
Using dashboards for presentations during client visits and the like, boosts your reputation as well as it shows that you have your operations under control and in one place. Moreover, the visibility that lets you access information from other concerned departments shows that there is transparency, which adds to the trust factor. Moreover, you can allow your client to filter the data according to his requirements.
Such interactive and insightful dashboards, made with simple graphics such as pie charts, bar charts and the like, basically make your work very much easier. Being dynamic and flexible, dashboards can be created to suit your business model and can adapt itself to your company’s look and feel. If you are looking for a way to integrate information from different departments in your organization, contact us.
Stay up to date on what's new
About the Author
Featured Blogs
Stay up to date on
what's new
Talk To Our Experts
One thing that is inevitable in every business enterprise, irrespective of size or industry, is decision making. It is also the one thing that is common to all managers irrespective of the level of management. As a manager, the performance of your team or company depends on the decisions you take for it. Therefore, the better your decisions are, the better will be your company’s performance.
In order to support you in your decision-making process, it is important to use the best possible tools so that you can make better, more informed decisions. One such tool, that makes use of analytics and makes internal decision making in an organization a lot easier is interactive reports or dashboards.
Of late, dashboards have become one of the most popular business intelligence tools, because of several reasons, the major one being that it is a lot cheaper. Apart from that there are several benefits. Here we describe an instance where we created dashboards for a US based client called Premium Retail, who specializes in providing retail solutions and helped them increase efficiency.
The dashboards (web applications) that we built for Premium Retail were highly interactive and insightful. We made two sets of dashboards in order to capture the Key Performance Indicators (KPIs) of their field agents and to show the coverage (channel coverage) percentage of the different divisions of the organizations. These dashboards converted the large amounts of data, handled by managers, into user-friendly visualizations which made analysis and interpretation much easier. They also had interactive charts with different kinds of filters which further helped in gaining critical insights in a matter of a few clicks. In all, the intuitiveness of these dashboards gave way to the following benefits to the organization.
- Better understanding of business operations – As all of the business flow/ logic was captured in a single application, it became easier for the managers to monitor and check for discrepancies or anomalies and take corrective decisions. For example, the dashboards showing the coverage percentage enabled the managers to get a snapshot of overall channel coverage nationally or state wise or even market or zip code wise very quickly and easily. Hence, the managers got a better understanding of the state of affairs which in turn helped them take better decisions.
- Better understanding of low-performance areas and employees – The dashboard was also used for tracking the performances of the field agents based on which the ones that require extra training and development could be narrowed down. It helped the managers take corrective actions in this regard and do the necessary in bringing up the efficiency and productivity of the employees ultimately improving the profit margin.
- Better time management – The managers of Premium Retail received huge amounts of data on a monthly basis and hence analyzing and interpreting them took a large amount of time earlier. But with these dashboards, the time they were able to save on analysis was massive. It helped them reduce the man hours required for interpreting the huge data points. They were able to garner useful and relevant insights very easily making the entire management of the data, a much easier and time-saving task.
- Budget control – These dashboards required only the initial costs of deployment. Hence, they were able to keep the costs that were involved in the analysis of data, well under check. For example, the cost of human resources required for analysis of the data could be reduced by a huge margin, as the installed dashboards could do the task.
All these benefits helped them bring up the productivity of their employees as well improve the efficiency of the organization as a whole.
With such performance tracking dashboards, you will be able to judge the efficiency of their employees whereby you are in a position to take better decisions regarding his employees. This improves your credibility and efficiency from the point of view of the top level management which increases your chances for promotions and appraisals as well. Dashboards not only help in increasing the efficiency of managers and department heads but also of the employees which in turn improve the overall efficiency of the organization as well.
Do you need help in managing large volumes of data and in developing useful insights out of the data? Talk to us! We can help you develop and enforce a custom software for your data and analysis.
Stay up to date on what's new
About the Author
Featured Blogs
Stay up to date on
what's new
Talk To Our Experts
PwC’s Global Data and Analytics Survey 2014 shows that 66% of banking and capital market executives have changed the way they approached big decisions in their organizations. The reason?
Data analytics.
Yes. Data analytics is increasingly changing the way banking and capital market executives approach big decision-making. The fact that it makes decision-making much more accurate, effective and faster is reason enough for this trend. Put together with cost-effectiveness, there is no reason why it shouldn’t influence big decisions.
Is your senior management prepared to take big decisions
According to the survey up to 52% of the most important decisions in the next 12 months among banking and capital market executives, is likely to be aimed at growth of an existing business. 45% is likely to be made with regard to corporate restructuring and another 42% is likely to be made in making a major investment in the business. Entering a new industry, changing an existing business model, collaborating with competitors etc. are other likely goals for big business decisions.
This just shows how important it is for the senior management of an enterprise to be fully prepared to make these decisions. Being fully prepared means being equipped with all the necessary data and analytical tools. Surprisingly, very few executives, that is, only 17%, believe that their management is fully prepared. The rest believe that their management is more or less unprepared. This could only mean that most of the senior decision makers refrain from using data analysis tools. They rely mainly on experience and intuition, either of their own or others.
Why this hesitation?
Now, what keeps managers and capital market executives from using data analysis more often for making big decisions?
42% of the executives found that the accuracy and quality of the data isn’t high enough. They found information overload to be a major problem as there was just too much data. This makes data analysis difficult and time-consuming. They felt the need for a more reliable data collection method to streamline data analysis.
Another 21% felt that their senior management lacks the necessary skills and expertise to use analytical tools. They felt the need to make them aware and convince them of its benefits.
No room for indecisiveness and intuitions
Using advanced analytical tools can make them better prepared for big business decisions. As a matter of fact, it is high time that they were. Almost 22% of executives in the survey estimated the value of their most important decisions in the next 12 months to be US$1 billion or more in future profitability. 38% expect to make such big decisions at least once in a month. That leaves almost no room for being indecisive or relying on intuitions alone.
The tools
Big decisions involve changes in the business strategy as such and hence, changes in the long-term course of the business. The bigger the decision, the more there is at stake and the more profoundly, analytical tools can help. There are various enhanced analytics that have come into use in the last 24 months like simulation, optimization and predictive analytics. The executives have also changed the way they presented these analytics to the management. These along with specialized analytical tools are what have brought the change in the approach of managers towards decision-making.
Who is in the dark
There is still a 22% of banking and capital market executives who haven’t made any kind of change yet, but plan to do so in the near future. Another 12% are still in the dark in this context.
Data analysis can essentially be said to be the lifeline of every business. It helps you make the right moves in your business. It helps you accurately analyze the various possibilities available for you to make those moves. Without analytics, you really cannot make any decision in business, let alone the big decisions.
Source : https://www.pwc.com/gx/en/issues/data-and-analytics/big-decisions-survey/industry/banking-capital-markets.jhtml
Stay up to date on what's new
About the Author
Featured Blogs
Stay up to date on
what's new


