Corporate Dashboards: Means to Save Time, Money and Reputation
Enterprises today have to deal with a fast paced business environment and truck loads of data coming from all directions. In order to keep up in the race for survival, organizations need to be as agile and alert as possible to overcome the challenges and adapt to the environment. Within the organizations too, data is growing rapidly. With all these complexities, it is necessary for the business managers to make some sense out of the incoming data on time and use it to boost the efficiency of their company.
In other words, the key to the success of any business lies in extracting relevant and actionable insights from the generated data, from anywhere in the world, in an organized and secure manner. It helps managers in making better, more informed decisions and thereby seize every opportunity that may come.
So what can be done to garner such insights? Or rather, what can be used to aid the process of decision making?
The answer is Corporate dashboards. We are all familiar with that term aren’t we? We also know that it is one of the most reliable and effective decision-making tools, as it helps managers get an overall top view of their enterprise by extracting Key Performance Indicators (KPIs). It also enables an easy analysis of the metrics in a user-friendly manner.
Using such dashboards helps organizations improve their efficiency as well as save a lot of time and money. It also adds to the reputation and goodwill of the company as a result. And how?
Before we get into the benefits of using dashboards, let’s see why organizations need dashboards.
Why dashboards?
Every manager in an enterprise, at whatever level of management he may be in, is responsible for decisions concerning his department or division. He has to go through and understand the corporate goals and at the same time manage his own department or team to achieve the goals set for his team. For this purpose, he will have to sift through various spreadsheets, reports and databases across the enterprise to collate information and make the best decision. However, he may not have the time for all this. On top of that, not all users may have access to all the information required to make decisions. These problems may make it difficult for the managers to make decisions.
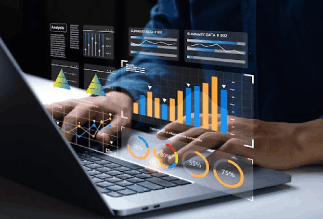
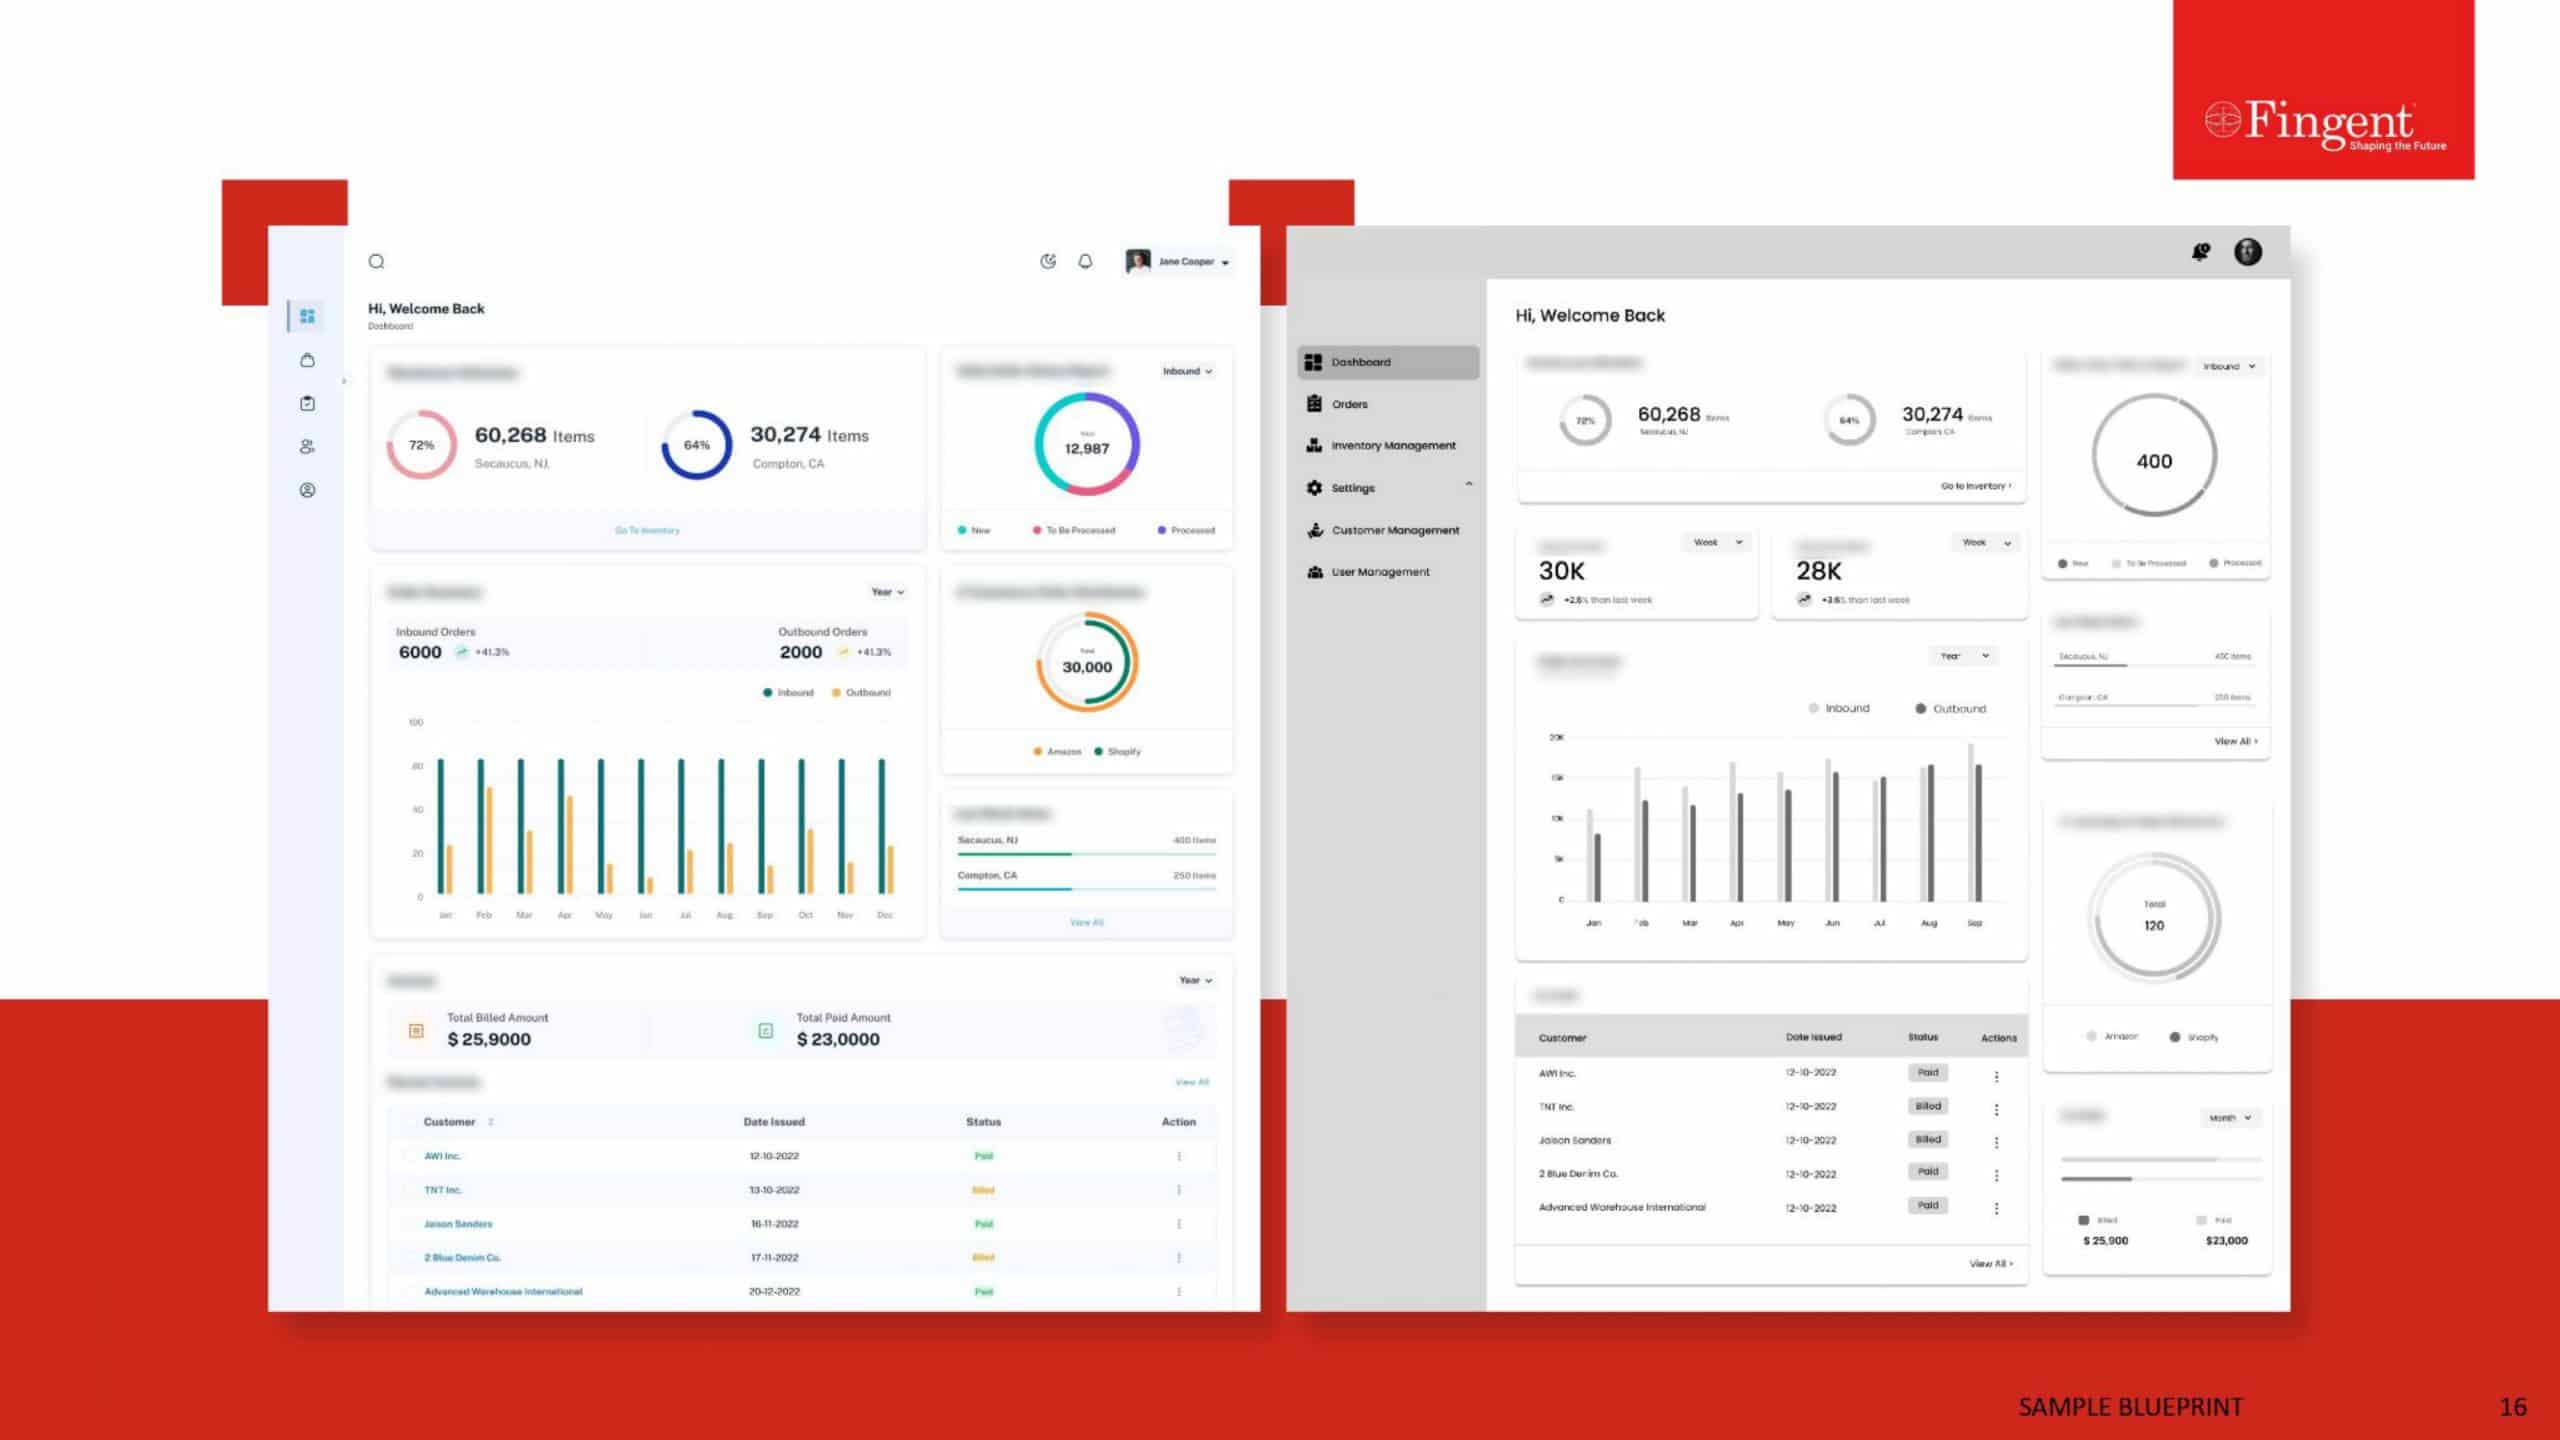
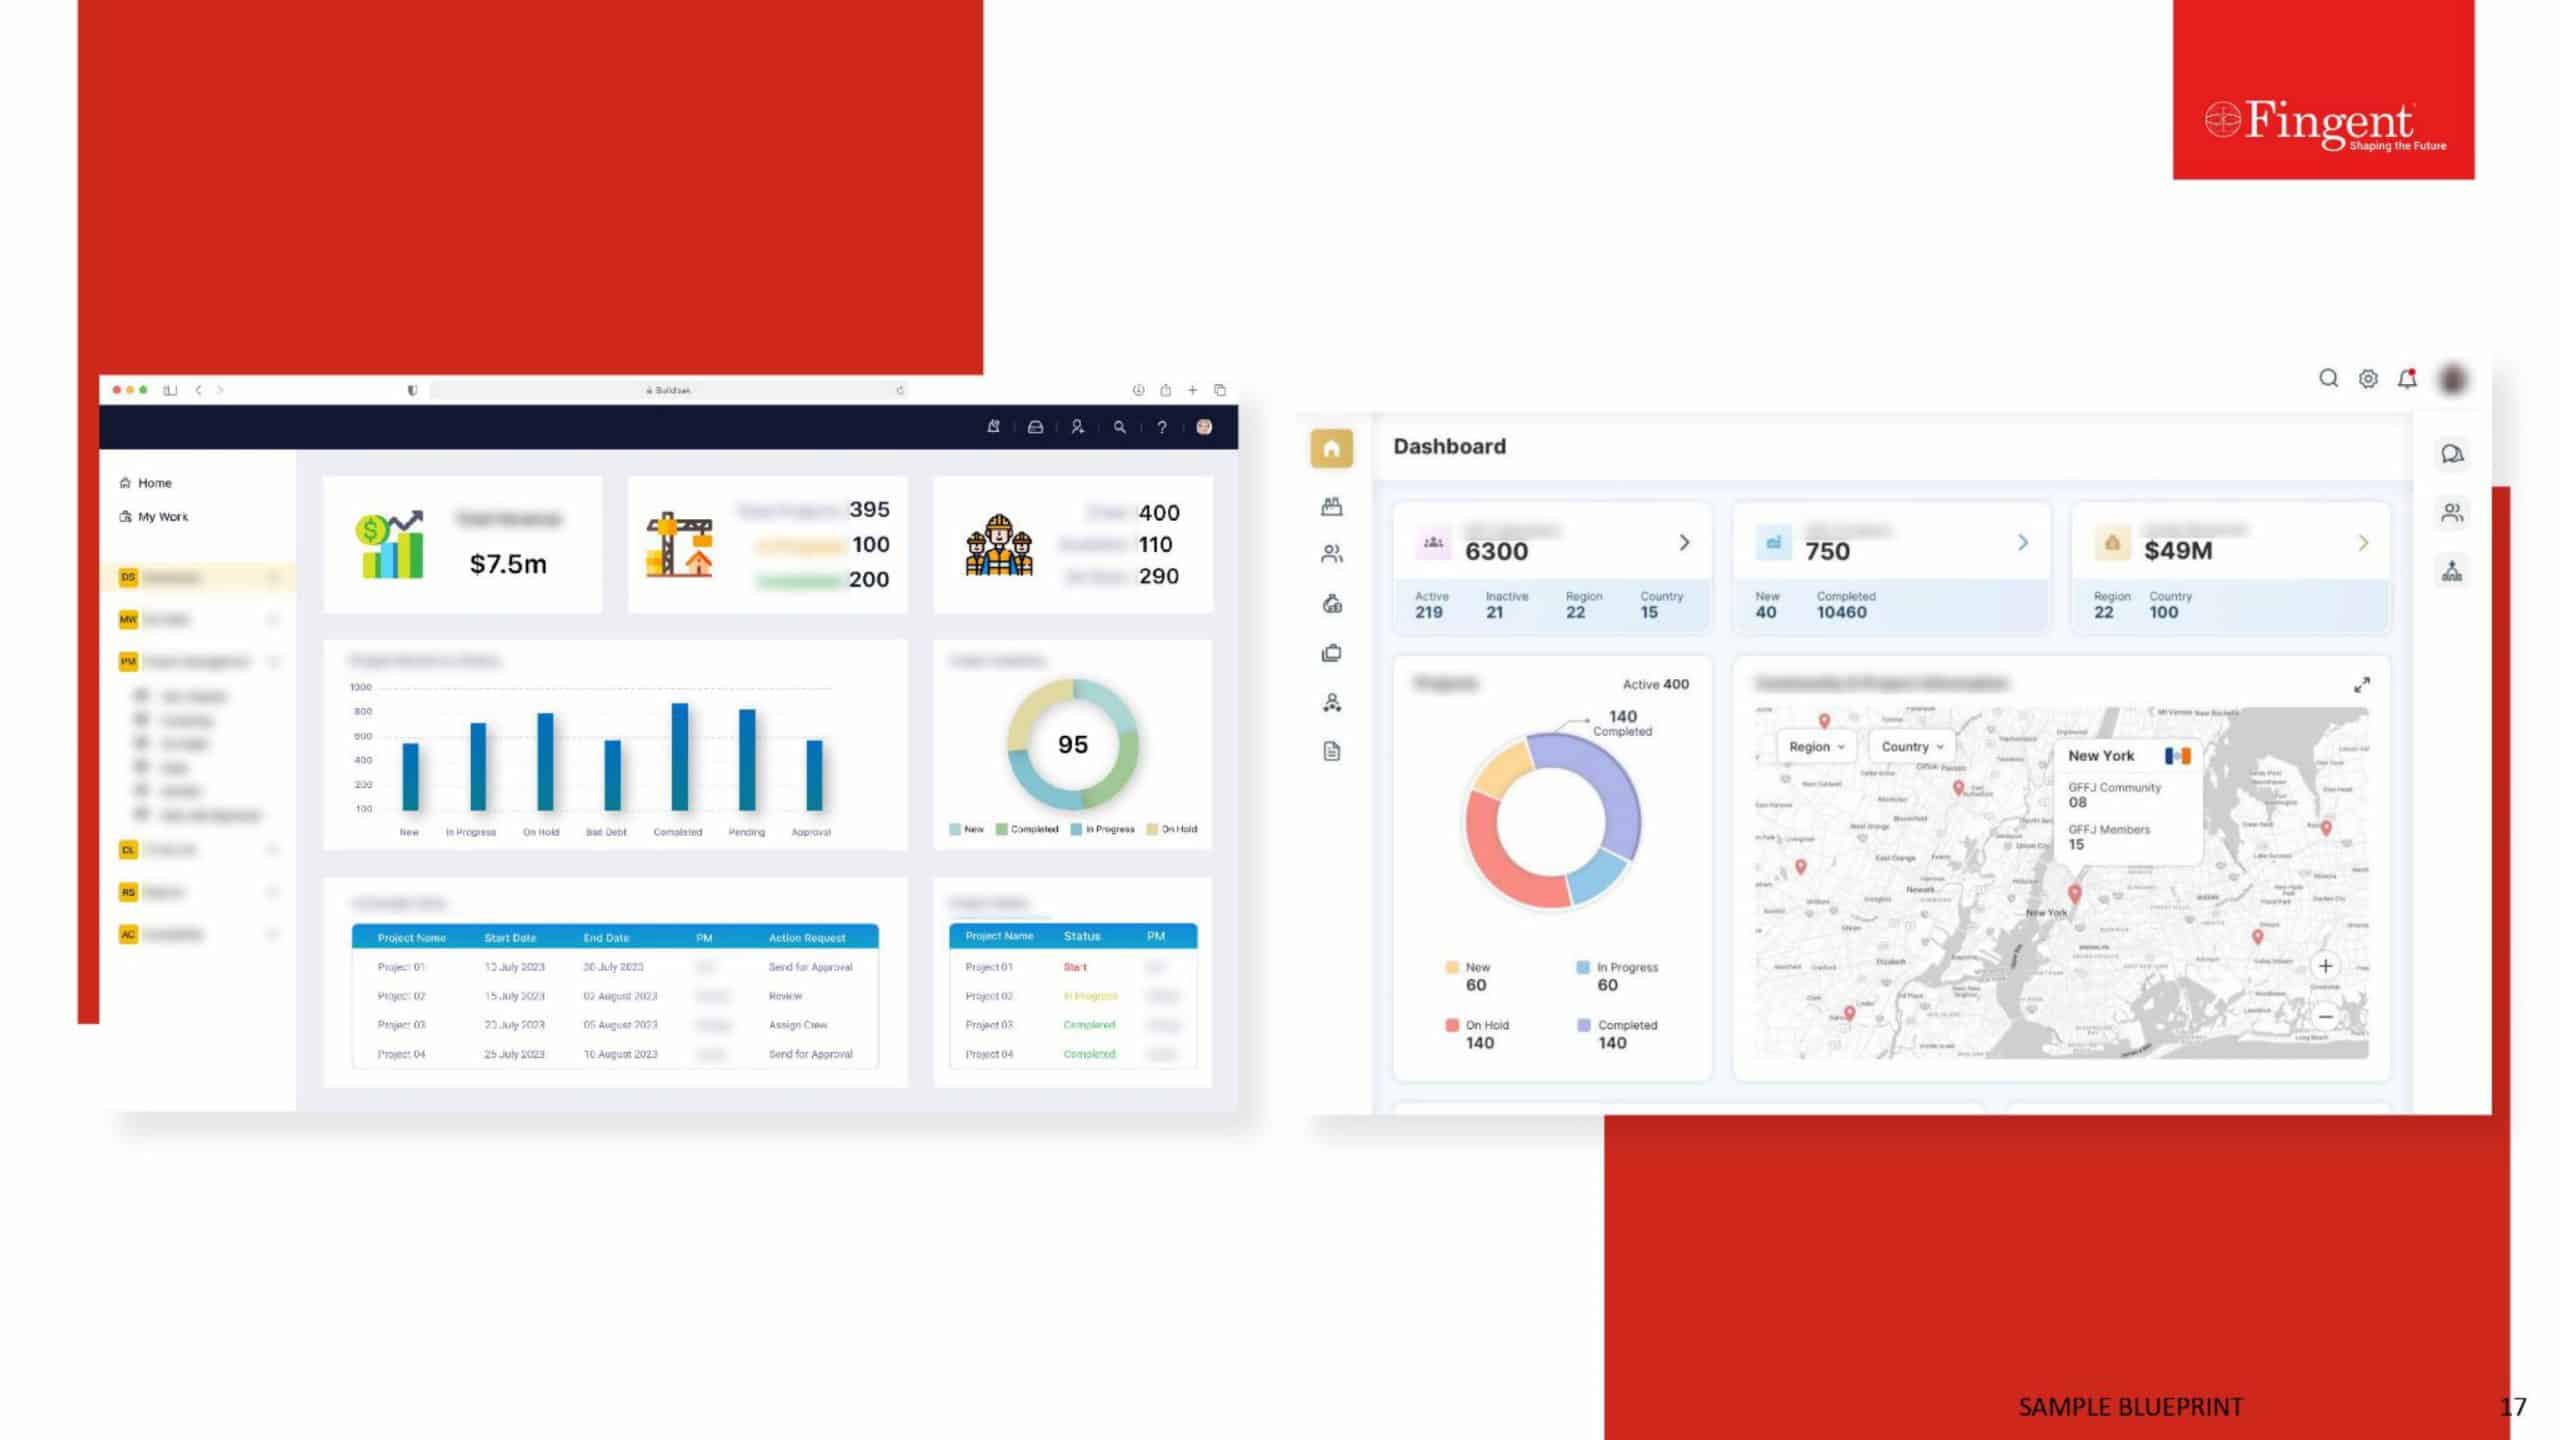
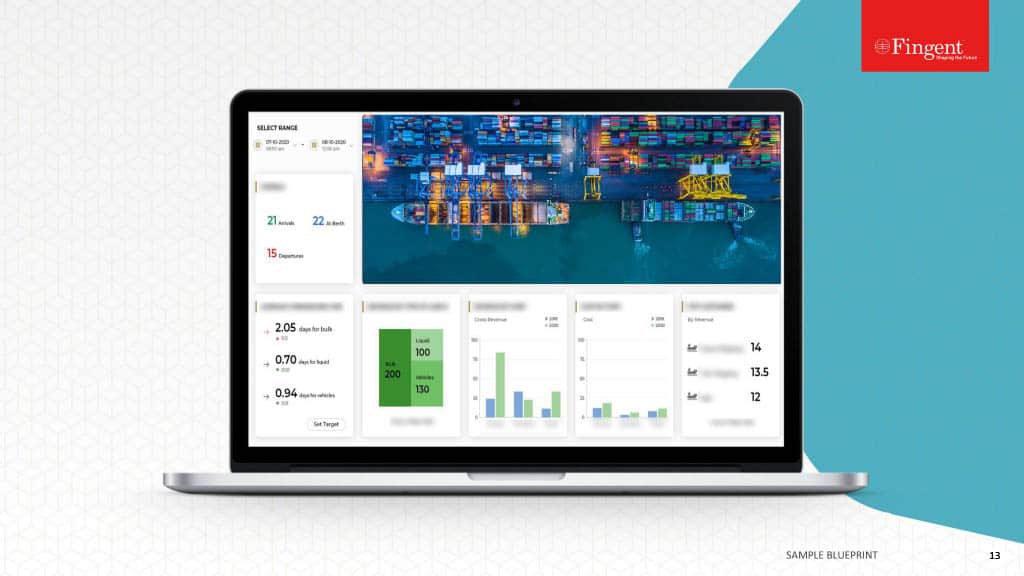
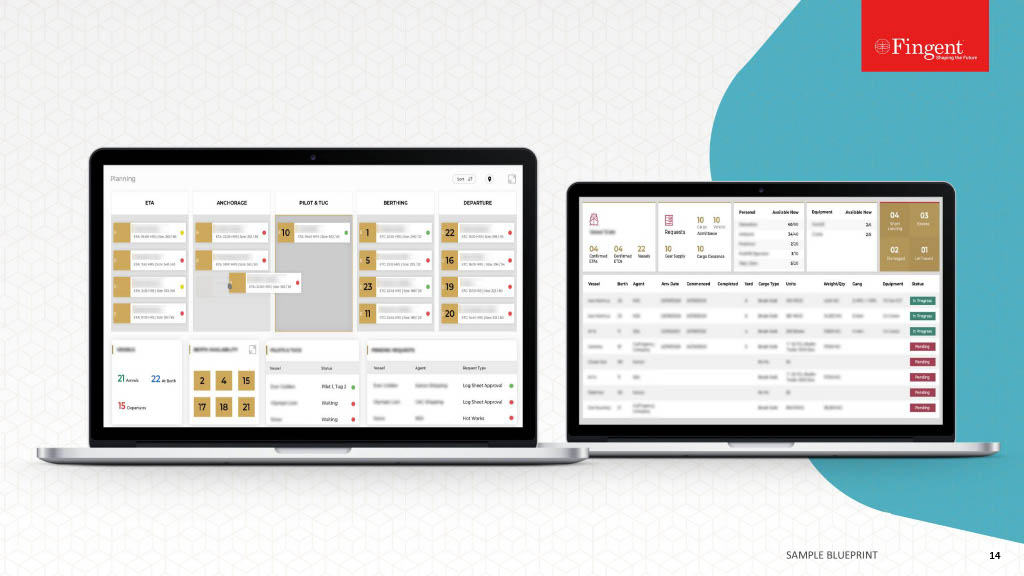
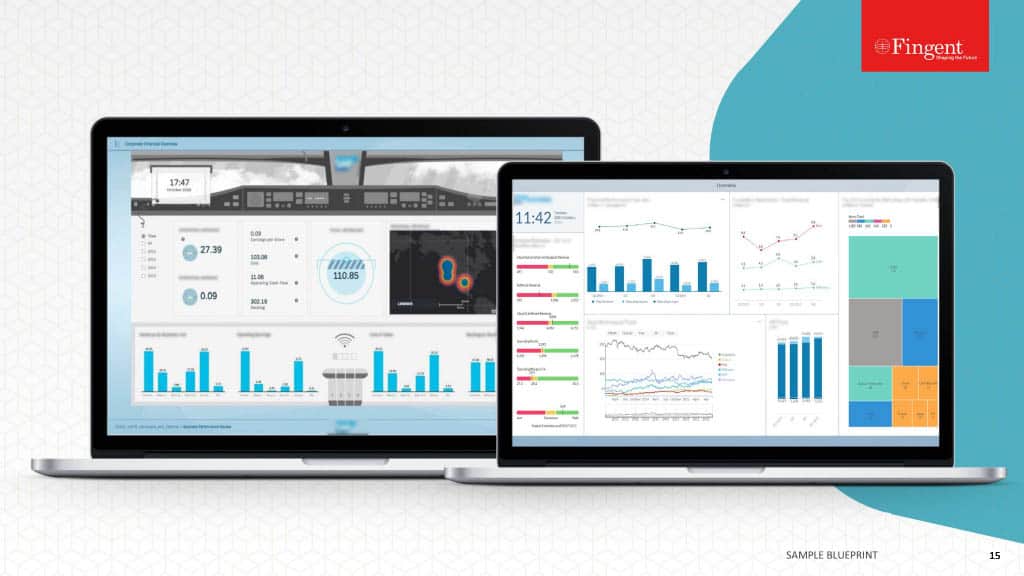
Dashboards, on the other hand, provide a clear and concise picture of the state of affairs, by integrating data from various sources into a single common platform. It presents such data in the form of insightful graphics, patterns, and the like and also highlights the pain points that require immediate attention.It enables managers to easily make faster and more accurate decisions.
How dashboards save you time, money and reputation
Typically, dashboards offer a number of general benefits such as:
- faster access to information
- ability to generate comprehensive reports
- graphical presentation of real time data
- better visibility into all required departments
- better transparency
- availability of all information in a single place
- insightful illustrations
To discuss how dashboards help in saving time and money, let’s consider a hypothetical situation.
You, being the sales manager of a leading advertising company, are psyched on winning a project with an international client. You are about to reap huge profits and take your company to new heights. On being the sole person creditable for this huge deal, you are required to give a presentation to your team regarding the client and the project. You have prepared your work with the help of presentations and reports and spreadsheets for accounts. Finally, on the day of the presentation, as you stand in front of your team with your laptop, you realize that you haven’t transferred your file from your personal system where you created it. You also find that the spreadsheet that you created does not have a whole page as you forgot to save it…..
The above scenario is the result of using traditional methods of presentation or work. Such spreadsheets and reports create a whole lot of confusion and complexities that you can actually avoid using dashboards. Imagine, having a dashboard that lets you access your client’s information directly in real-time. One that lets you extract specific relevant information in the form of reports on the spot, in case you want to show some financial information.
Dashboards allow you to get all the important information in a single place, rather than through separate files and reports. It thus lets you save a lot of time that you would otherwise have spent on making the presentation with spreadsheets and documents, collating information from various departments etc. It also lets you save money used in buying and maintaining spreadsheet software and in making frequent visits to your client’s site.
Using dashboards for presentations during client visits and the like, boosts your reputation as well as it shows that you have your operations under control and in one place. Moreover, the visibility that lets you access information from other concerned departments shows that there is transparency, which adds to the trust factor. Moreover, you can allow your client to filter the data according to his requirements.
Such interactive and insightful dashboards, made with simple graphics such as pie charts, bar charts and the like, basically make your work very much easier. Being dynamic and flexible, dashboards can be created to suit your business model and can adapt itself to your company’s look and feel. If you are looking for a way to integrate information from different departments in your organization, contact us.
Stay up to date on what's new

Recommended Posts

28 Apr 2023 B2B
Utilizing SAP Analytics Tools to Turn Your Data Into Valuable Insights!
SAP is widely known for its brilliant abilities and functionalities, the foremost being Data Analysis. The newest version of SAP ERP is the SAP Data and Analytics Solution. It has……
18 Feb 2022 B2B
Top 10 Data and Analytics Trends Ruling the Roost in 2024
Over 95% of businesses struggle to manage unstructured data in their day-to-day operations. Inability to decipher data prevents them from navigating the market successfully, making business forecasts, and customizing their……

12 Sep 2020 Sports
Why Sports Analytics is a Crucial Ingredient in Today’s Match Winning Formula
Analytics in Sports: Redefining the Tactics of Winning Games with Statistical Data Sports used to be simple. Play the game and compete to win. Entertainment value aside, athletes and teams……

22 Jul 2020 Education
Prepare for the Future of Digital Innovation with these 10 Services From Fingent
10 Services Offered by Fingent to Prepare Your Business for the Future of Digital Innovation Introduction Robotic Process Automation Business Continuity Planning Contactless Services Custom LMS | eLearning Business Process……
Featured Blogs
Stay up to date on
what's new


