Tag: Big data Analysis
Analytics in Sports: Redefining the Tactics of Winning Games with Statistical Data
Sports used to be simple. Play the game and compete to win. Entertainment value aside, athletes and teams would target to compete better than the others in order to win competitions, to get those points on the board, and get their hands on the prize. The bonus- fame, money, and fans!
When it came to improving abilities, athletes and sportspersons trained hard, worked on their fitness and skills in order to reciprocate that out on the field of play. Coaches monitored, advised, and mentored them enabling the players to get better and fitter so that they could outperform their opponents. Fans followed their beloved teams and stars through various forms of media all the way from print to electronic.
When it comes to gaining a competitive edge today, training and working hard are not enough. An athlete or a sportsperson needs to know more about specific areas they need to improve, how they can maximize their strengths and minimize their weaknesses, how they can target the competition among many other areas. The necessity to identify those minute yet significant attributes and generate new metrics and key performance indicators has prompted data analytics to make its foray into sports.
Discover the applications and dimesions of sports software with Fingent. We provide Custom software and analytics solutions for the sports industry to keep track of athletic performance, to create engaging fan experiences, and with the power of analytics assist your coaching staffs with better statistics.
Analytics – The New Player
Analytics has completely disrupted the way organizations go about with their businesses by using the one commodity that globally, every industry, or every business across every domain generates: Data!
Data is what runs the show today. And it is analytics that has changed the world by using this data in infinitely creative ways to provide individuals, groups, or organizations with insight into what the data means, what information can be obtained from this data and how can this information be used to deliver positive outcomes.
Read more: How Cognitive Computing is Revolutionizing the World of Sports
What does Analytics do?
Analytics identifies this data and gathers it into a common ground so that it can be structured into information. And this information generates insights that drive business decisions. Business decisions power growth and growth defines success.
Simply speaking, analytics is a linear trajectory that empowers an individual or organization to transform itself. Analytics can be thought of as not only identifying and interpreting data but also the application of data patterns and various techniques that help in effective decision-making. Decision-makers use this information to identify past trends and make informed decisions that can have future business implications.
Consider the thought – ‘If only three out of five routes were being used by commuters to travel from New York to Boston yesterday, then improving the other two and adding two more routes could reduce travel time by 25% within the next 5 years assuming the rate of growth of traffic on the road stays constant at 15% annually’.
Analytics has changed the way we ask questions. The above example is meant to be some of the simpler scenarios of insight that one may gain using data analytics. The richness of data harnessed the power to make informed decisions. That is what analytics does.
And now, the Sports industry has a new best friend.
Analytics and Sports
While the theory of sports analytics and the study of performance statistics might have been around since the 1980s, it was hugely popularized by Billy Beane – General Manager of the American baseball team the Oakland Athletics during the late 90s and early 2000s. Some of you might be familiar with the movie or the book Moneyball. Moneyball was inspired by Billy Beane’s study of Sabermetrics or the empirical analysis of baseball statistics that measure in-game activity. Beane implemented methods to identify key performance indicators of players that would collectively bring in an improvement on his team’s performance in the long run. Using this approach, he built a competitive team that, despite having one of the lowest operating budgets out of over 30 teams in professional American baseball, consistently managed to produce performances placing them in the top five to ten teams in their league.
Global sports analysts and industry experts have remarked that the sports analytics industry is potentially expecting to reach a value of $5.2 billion dollars by 2024. Not bad for an industry that had a market value of around $125 million just about a decade ago.
Analytical approaches, however, are different when it comes to different sports. For example, baseball and cricket generate a majority of their data points during one to one interactions between players on the pitch, such as a pitcher pitching to a batter or a batsman hitting the ball towards a specific fielder. The approach used here could not be implemented in a game like Football (Soccer) or Basketball where multiple players are interacting with each other simultaneously with interactions becoming more attached among themselves if the ball happens to be closer to them.
There is no hard and fast rule when it comes to what techniques can be applied and that is where the beauty and challenges lie when it comes to applying analytics to sports.
Key areas in Sports that Implement Data Analytics Techniques
Here are some key areas in sports that implement data analytics techniques as sports organizations look to maximize performance and revenue.
1. Performance Tracking and Analysis
The seemingly minute margins are what make the difference between winning and losing. This is where analytics has helped athletes and teams improve themselves both physically and mentally.
Gone are the questions such as ‘How many goals did we score?’ or ‘How many assists does Player A have?’. Today the questions asked are more along the lines of ‘Player A has a pass percentage of 95.6 from which 47% of those passes were 15-yard passes. 34.5% of these 15-yard passes were forward passed. What percentage of those passes created a goal-scoring opportunity for our forward?’
or
‘Player B has made 4.5 interceptions per game over the last 25 matches out of which 80% of them happened in the middle third section of the pitch. If we can have player A close to B during these interceptions, A could then pick up the ball and make a 15-yard pass to quickly release our forwards, could he not? This ideally means that we should pair players A and B closer together in our matches.’
Once again, the examples mentioned above are some of the less complex questions that are asked with respect to utilizing analytics across sports teams. And it only gets more interesting from there.
2. Monitor and improve performance
Giving coaches and managers data ranging from the distance covered, area coverage maps, heartbeat rates to passing percentages, shot classification, positioning data, and much more allows them to analyze in great depth. Devices such as fitness bands and video cameras coupled with custom algorithms enable the recording of such data which is presented to the coaches and managers as part of a massive statistical datasheet. This gives them the flexibility to identify key statistics and use them to plan training patterns and routines.
Coaches can use this data to tailor specific training programs for their teams and individual athletes that can help them improve on key performance areas relevant to their playing style. On another front, the data can also be used to identify key improvement areas so that specific drills and exercise routines can be implemented to develop on them. Or, this data can be used to target specific weaknesses of rival players so that the team can exploit them to gain a tactical advantage.
3. Fan Engagement
The last couple of decades saw technology and digitization invading the sports industry in a way that nobody could even think of 20 to 30 years back. With smartphones and mobile apps getting so popular today, sports teams and organizations are utilizing technology to engage with their fans to provide better customer experiences, gradually increasing the marketability of sports.
Sports franchises have used mobile apps coupled with analytics to improve the experiences of match-going fans. Fans can be rewarded with discounts, ticketing offers, merchandise offers, VIP seats, or player engagement opportunities based on their attendance, seat preferences, snack preferences, and more. Fans also stream matches online today. With applications utilizing basic information to identify fan demographics such as age, location, and teams they support, sports clubs and franchises have found ways to offer personalized packages to fans that enhance their user experience.
Television and digital media are used as platforms where fans can interact not only with each other but also their players, club officials, sports pundits, and analysts as they come together to exchange ideas, opinions, and to network. Having team and player performance statistics available for visualization to the everyday fan brings out the analyst in them as well, giving them the sense of being more involved with their favorite sport, team, and heroes on the pitch – a sense of ownership if you will.
Read our case study: Legends Personal Training 3.0 – How Fingent developed a fitness regimen app for a select group of personal trainers and health professionals in Wimbledon and Kingston.
How Analytics Boosts Revenue Generation in Sports
Generating revenue is undoubtedly one of the most important aspects of running a business. This applies to sports companies too – be it running a sporting franchise, a team, or a league.
Some of the common avenues that sports teams explore include television deals for broadcasting games, ticketing for stadiums, corporate sponsorships, merchandising, and of course, player trades or transfers.
Examples of how analytics contributes to sports revenue:
- Analysts could identify leagues with potential based on past victories, player potential to attract crowds. For example, leagues, where teams have larger stadiums, would be prime candidates to earn more money through ticket sales.
- Using data, sports teams can identify the fans who attended the games, made in-stadium purchases, and the movements within the premises. This information could be pivotal for the corporate personnel as it would enable them to have a greater focus on sponsor targeting and engagement both within the stadium and outside.
- Merchandising is a key component of a sports team’s revenue-generating model. Using fan information from ticketing, fan engagement events, or even previous purchases at the club’s stores, the decision-makers could identify potential other locations to expand their reach – enabling fans to buy merchandise of their team far easier.
- Player Transfers – There are various examples of transfer fees paid by a buying club to the selling club in order to facilitate a purchase for the services of a player. How would analytics play a role in this? There are many factors that determine the ‘value’ of a player – such as his/her current form, age of the player, the relative proximity of the player’s ability in terms of current ability and peak potential, marketability of the player, and various other factors. Analysts work out algorithms using a variety of these parameters to determine optimal market values which are then used as a starting point for any player trade or sales.
Read more: iBeacon Technology in Sports and Other Industries
The Potential of Analytics in Sports
The potential of analytics in sports is enormous. Though the sports industry has debuted analytics only lately, industry experts are trying to dive deeper into the implementation of data-driven decision making. Looking at the rising number of use cases and business benefits, it’s no surprise to say that the future of professional sports lies in the hands of sports analytics.
Fingent offers a wide array of custom software and analytics solutions for sports organizations that help them manage their basic to the most complex challenges. Get in touch with us to learn more.
Stay up to date on what's new

About the Author

Featured Blogs


Stay up to date on
what's new


Talk To Our Experts
Can Data Warehousing Enhance the Value of Data Visualization & Reporting?
Organizations rely heavily on data to make crucial business decisions. Hence, it is important for your business to have access to relevant data. That is where a well-designed data warehousing comes to your rescue!
Besides gaining actionable insights, corporate executives, business managers, and other end-users make more informed business decisions based on historical data.
Today’s Analytics and Business Intelligence solutions provide the ability to:
- Optimize business processes within your organization
- Increase your operational efficiency
- Identify market trends
- Drive new revenues
- Forecast future probabilities and trends
Before understanding how data warehousing can add more value to data visualization and reporting, let’s take a look at what these terms mean.
Analytics and Business Intelligence
Business Intelligence is a process that includes the tools and technologies to convert data from operational systems into a meaningful and useful format. This helps organizations analyze and develop meaningful insights to take timely business decisions. The information derived from these tools demonstrate the root cause of your business problems and allow decision-makers to strategize their plans based on the analysis.
Business Intelligence is information not just derived from a single place, but multiple locations and sources. It can be a combination of the external data derived from the market and the financial and operational data of an organization that is meaningfully applied to create the “intelligence”.
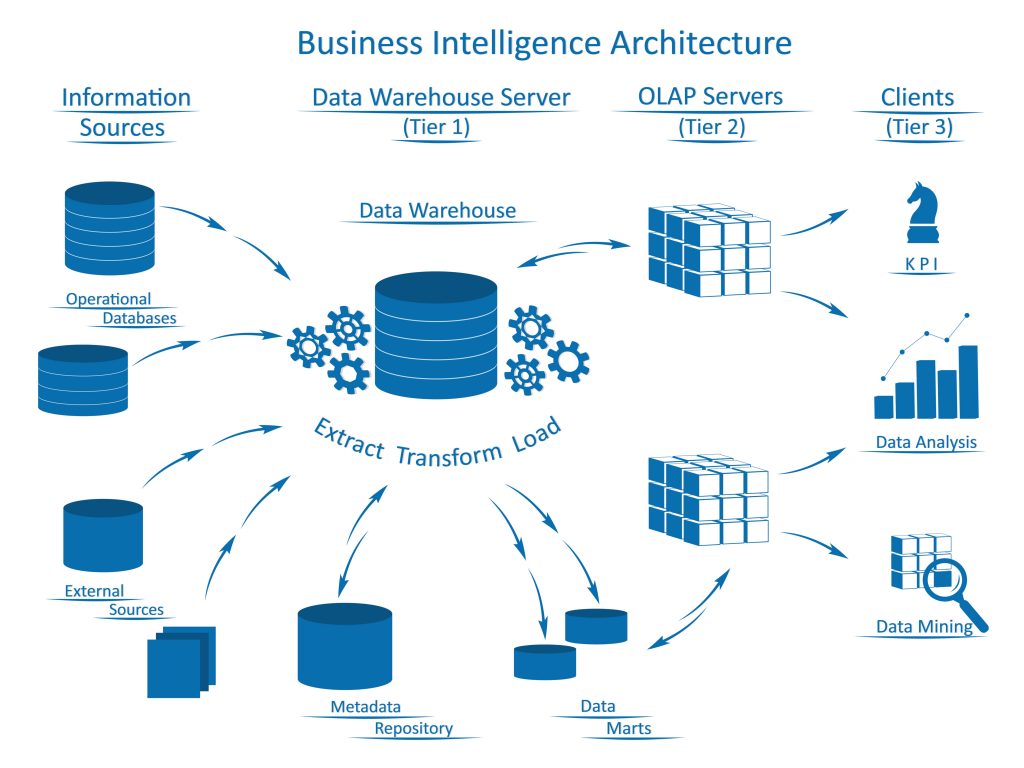
Data Warehouse
Data warehouse is a repository that collects data from various data sources of an organization and arranges it into a structured format. An ideal data warehouse set up will extract, organize, and aggregate data for efficient comparison and analysis. Data warehouse supports organizations in reporting and data analysis by analyzing their current and historical data. This makes it a core component of Business Intelligence.
Unlike a database, that stores data within, at a fully normalized or third normal form (3NF), a data warehouse keeps the data in a denormalized form. It means that data is converted to 2NF from 3NF and hence, is called Big Data.
Key benefits of a Data Warehouse
- Combine data from heterogeneous systems
- Optimized for decision support applications
- Storage of historical and current data
Why We Need Data Warehouse for Business Intelligence?
Before the business intelligence approach came into use, companies used to analyze their business operations using decision support applications connected to their Online Transaction Systems (OLTP). Queries or reports were retrieved directly from these systems.
However, this approach was not ideal due to:
- Quality issues
- Reports and queries were affecting business transaction performance
- Data resides in heterogeneous sources
- Non-availability of historical data
- Non-availability of data in the exact form required for reporting
Connecting your organization’s business intelligence tools to a data warehouse can provide you benefits in terms of production, transportation, and sale of products.
Data Visualization vs. Data Analytics – What’s the Difference?
Data Warehousing and Business Intelligence Using AWS
Today, traditional BI has given way to agile BI where agile software development accelerates business intelligence for faster results and more adaptability. Big Data is growing fast to provide useful insights for making improved business decisions.
There has been a paradigm shift in data storage with warehousing solutions moving increasingly to the cloud. Amazon Redshift, for instance, is one of the most popular cloud services from Amazon Web Services (AWS). Redshift is a fully-managed analytical data warehouse on cloud, that can handle petabyte-scale data, which enables analysts to process queries in seconds.
Redshift offers several advantages over traditional data warehouses. It provides high scalability using Amazon’s cloud infrastructure to set-up and for maintenance, without the need for upfront payments. You can either add nodes to a Redshift cluster or create additional Redshift clusters to support your scalability needs.
You can use AWS Marketplace ISV Solutions for Data Visualization, Reporting, and Analysis.
Data visualization helps you identify areas that need attention or improvement, clarify factors that influence business such as customer behavior, and making decisions such as finding out a suitable market for your product or predicting your sales volumes, and much more.
TIBCO Jaspersoft, for example, is a solution that delivers embedded BI, production reporting, and self-service reporting for your Amazon data at affordable rates. It features the ability to auto-detect and quickly connect to Amazon RDS and Amazon Redshift. Jaspersoft is available in the AWS Marketplace in both single-tenant and multi-tenant versions. TIBCO Jaspersoft for AWS includes the ability to launch in a high availability cluster (HA) as well as with Amazon RDS as a fault-tolerant repository. Pricing is based on the Amazon EC2 instance, type as well as the chosen single or multi-tenant mode.
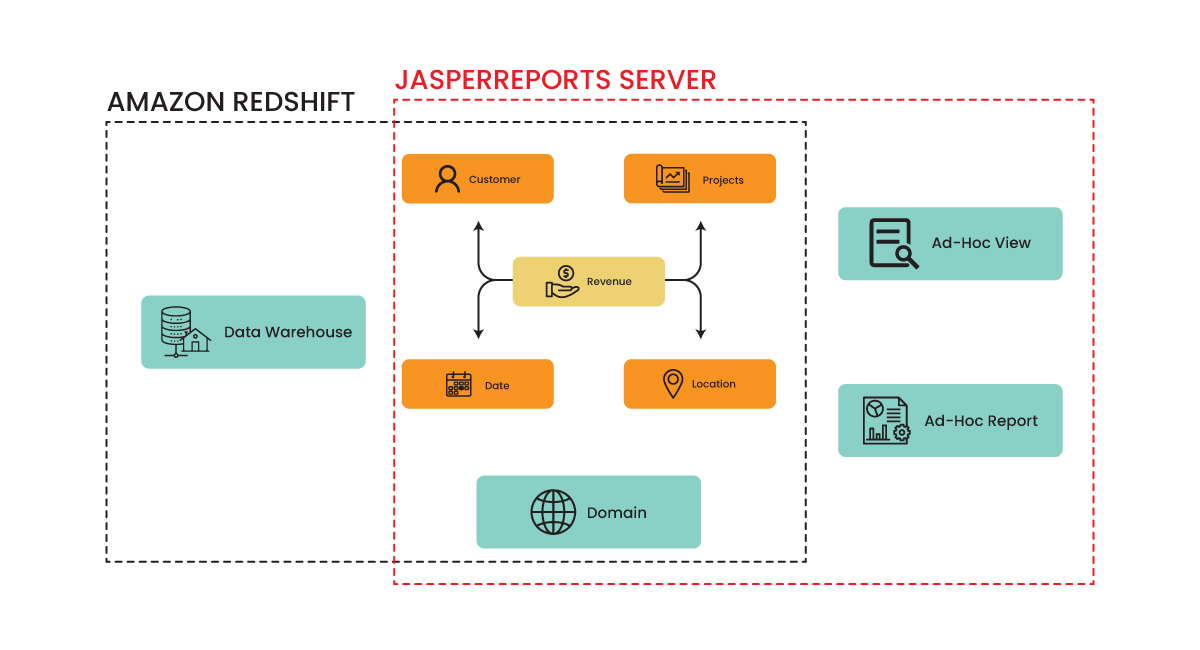 Image source: http://bit.ly/2IWWCDn
Summary
By moving your analytics and business intelligence to a hybrid cloud architecture you will be able to handle huge amounts of data and scale at the rate of expansion required by your business. You will also be able to deliver information and solutions at the speed that your employees and customers demand, and gain insights that will enable your organization to innovate faster than ever.
Business Intelligence and Data Warehousing are two important aspects of the survival of any business. These technologies give accurate, comprehensive, integrated, and up-to-date information on the current enterprise scenario which allows you to take the required steps and make crucial decisions for your company’s growth. To know how your business can benefit from the latest technologies, get in touch with our custom software development experts today!
Stay up to date on what's new
About the Author

Featured Blogs
Stay up to date on
what's new
Talk To Our Experts
Step By Step Guide To Help You Choose The Best Infrastructure For SAP HANA
Businesses today are undertaking the move to SAP HANA following the 2025 deadline by the Enterprise giant SAP who assuredly states that after 2025, all its’ systems will be built to run on only a single database, which is SAP HANA.
Why Choose SAP HANA
Along with providing a single and secure environment for all your mission-critical data assets, SAP HANA can ensure an increased improvement in the total cost of ownership as it is capable of managing large chunks of structured as well as unstructured data.
SAP HANA is tailored to enhance business outcomes as it is one of the prime data management platforms that came into being first and also is competent enough to handle all transactions and also memory analytics on a single data copy. Data integration and quality are other 2 key characteristics.
On a second note, if machine learning and predictive analysis along with advanced analytical processing are paramount for your business, then SAP HANA is definitely the best choice as your data management platform.
In this era of digital reinvention, SAP HANA can reduce administrative efforts considerably now and in the future by rapidly improving application development capabilities in today’s digital landscape.
Related Reading: Read on to learn how SAP HANA adoption is the new game changer trend.
Ways To Choose SAP HANA As A Digital Growth Strategy
S/4HANA can be an integral part of a digital deployment and management platform for creating innovation and building business value for your company.
Also, obtaining real-time updates is crucial that SAP HANA provides along with big data analysis. When HANA is implemented into your SAP system, it helps in building an in-memory database which helps in providing faster execution. This can provide a wider digital reinvention strategy now and in the future to increase business outcomes. Let us now look at ways to choose the best infrastructure for SAP HANA and what it can offer to your business:
Related Reading: Find why should you choose SAP and how should you plan your budget for it.
1. Real-time problem solving
Real-time update paves the way into an increased business size. With SAP HANA, the data architectures have moved to complex data structures to provide a business process analysis using these real-time updates. The advanced analytical processing power of SAP HANA gets complex calculations performed in real-time and provides answers to the most pressing concerns in your business.
Also, creating visual insight-filled applications have been made easy with SAP HANA implementation.
2. Big data Analysis
Decisions are well-informed than ever before with the implementation of SAP HANA. Multidimensional analysis that leverages spatial and business data to create applications that overcome the performance of traditional databases.
SAP HANA can be thus used as the enterprise database for market-leading solutions.
3. All-Transactions On A Single Platform
SAP HANA is set up to be incorporated as an in-memory database system. High speed is a major advantage. Data integration and effective analytics contribute to the infrastructure.
Analyzing malicious use of the system and predictive analysis is thus made easier through this high-speed data processing technique.
4. Flexibility
Appliances and Tailored Data-Centre Integration (TDI) are the 2 major types of HANA platforms of SAP. This includes a pre-integration of both hardware and software systems. The integration of hardware can provide increased performance and response times. This also ensures key features such as peak performance, memory space, disk space, average load, CPU space, etc. These values are based on the various business processes, a number of users, other factors such as data retention times and much more.
5. Resilience Power
If long term performance is one among your core requisites, the SAP HANA requires the right infrastructure for faster in-memory execution. A proper environment and infrastructure can support application migration as well with ease before failures can happen.
For this, it is important to ensure that the data is not changing rapidly and unpredictably as it can cause the in-memory to slow down considerably.
6. Scalability
Statistics show that SAP HANA, though slow initially can increase the natural growth of structured data by about 20 percent yearly. Unlike other platforms, SAP HANA can take all the data onto the same platform, thus enabling scalability, in the long run.
This feature as it provides scalability feature for the company, it also provides the company with an added advantage of not having to implement fragmented deployments or other complex settings.
7. SAP Suite Of Comprehensive Services
Big data analytics, a well-optimized and simple data structure, and an incorporated in-memory database together under a single roof ensure a suite of comprehensive business services from SAP HANA that enables users to work with high speed and virtualization capability.
8. S/4 HANA Suite
When a user needs to migrate, the Suite on HANA is readily available. A Suite is a tool that can be used for migrating from databases such as Oracle to SAP HANA. It provides users with optimized objects and code that yields a better and improved business performance and migration.
9. Accelerated Insights
Multi-threading features in SAP HANA ensure the availability of insights for your business. This helps in analyzing what changes are to be made to the existing system or what new features to be incorporated are.
10. Spatial Solutions
The advanced analytical power of SAP HANA can help in real-time calculations. This helps in building a better forecast on how to approach your business for profitable outcomes and also to understand what SAP HANA integration can do to your newly transformed system. Spatial and business data are thus leveraged to gain solutions for a faster business process.
11. Data Protection
Business analytical processes demand protection. SAP HANA is well-structured to store hybrid applications from entry-level to large businesses. This also reduces data center footprints and increases performance.
SAP Insider has introduced ‘Iterative Sizing’ feature to analyze and measure system requirements. They are a 5-step process and is described as follows:
- Create a sizing project and enter relevant data.
- Obtain an initial sizing result for CPU, disk, and memory.
- Apply according to all SAP HANA guidelines.
- Check to verify all hardware configurations as provided in the SAP HANA directory.
- Provide the required SAP HANA vendor.
These 5 steps provide all the required steps to gather information about the infrastructure.
Related Reading: SAP Vs Oracle- Find who is winning in the race.
The quality operations of SAP HANA are essential as a good level of infrastructure build is required for the transfer of data to the server RAM from the disks. This can successfully implement SAP HANA into your business process. To get personalized assistance on choosing the right infrastructure for SAP HANA, get in touch with us today!
Stay up to date on what's new
About the Author

Featured Blogs
Stay up to date on
what's new


