Tag: Exploratory Data Analysis
Over 95% of businesses struggle to manage unstructured data in their day-to-day operations. Inability to decipher data prevents them from navigating the market successfully, making business forecasts, and customizing their offerings to match the changing market trends. This proves why data analytics is crucial in enterprise strategy planning. By 2030, the global big data and analytics market value is expected to touch $684.12 billion. As more companies embrace data analytics to enhance customer experience, optimize existing business processes, and lower costs, it’s important to take note of the data and analytics trends that will hold the reins in 2024 and beyond.
Here’re ten trends to behold:
1. Scalable and Responsible AI
Research and Markets report that AI makes analytics 48% more effective for industry applications. Traditionally, artificial intelligence (AI) techniques were applied to analyze historical data. However, unpredicted events such as the COVID-19 pandemic increase the demand for real-time data analysis. Adaptive machine learning promotes scalable, responsible, and intelligent AI that offers insightful business analytics even with smaller datasets. Scalable AI will enhance learning algorithms, reduce time-to-value, and make business systems and data more interpretable. AI integration will increase the precision of data analysis in 2024.
Read more: 6 Ways Artificial Intelligence is Driving Decision Making
2. Hybrid, Multi-cloud, and Edge Computing
According to McKinsey, 70% of companies will adopt hybrid or multi-cloud technologies and processes by 2022. Hailed as the hallmarks of distributed IT infrastructures, multi-cloud management and edge computing enable companies to extend their computing capacity to the edge of their networks. This allows businesses to reach more data-hungry devices as the data is analyzed locally, close to the data source. Edge and multi-cloud reduce latency and improve decision-making with advanced, on-demand analytics. Today, every business generates volumes of unstructured data. Relying on traditional batch-based reporting to analyze big data cannot help anymore. 2024 will see the rise of distributed cloud models powered by hybrid, multi-cloud, and edge environments.
Read more: Future-proof Your Business with 5G, Edge Computing, and Cloud
3. Data Fabric Architecture
Data fabric architecture supports businesses to seamlessly navigate the complex digital business landscape that generates a lot of unstructured data every minute. It allows organizations to adopt a modular approach, known as composability, through which organizations can integrate new capabilities or features as low-code, reusable, individual components. Unlike the traditional monolithic architecture, composability allows businesses to integrate new features and changes to their enterprise applications without redoing their tech stacks. According to Gartner, data fabric reduces the deployment time by 30% and maintenance time by 70%. The ability to reuse technologies and capabilities from numerous data hubs, data lakes and data warehouses is expected to go a long way in tailoring analytics experiences.
4. Data Democratization and Self-service Analytics
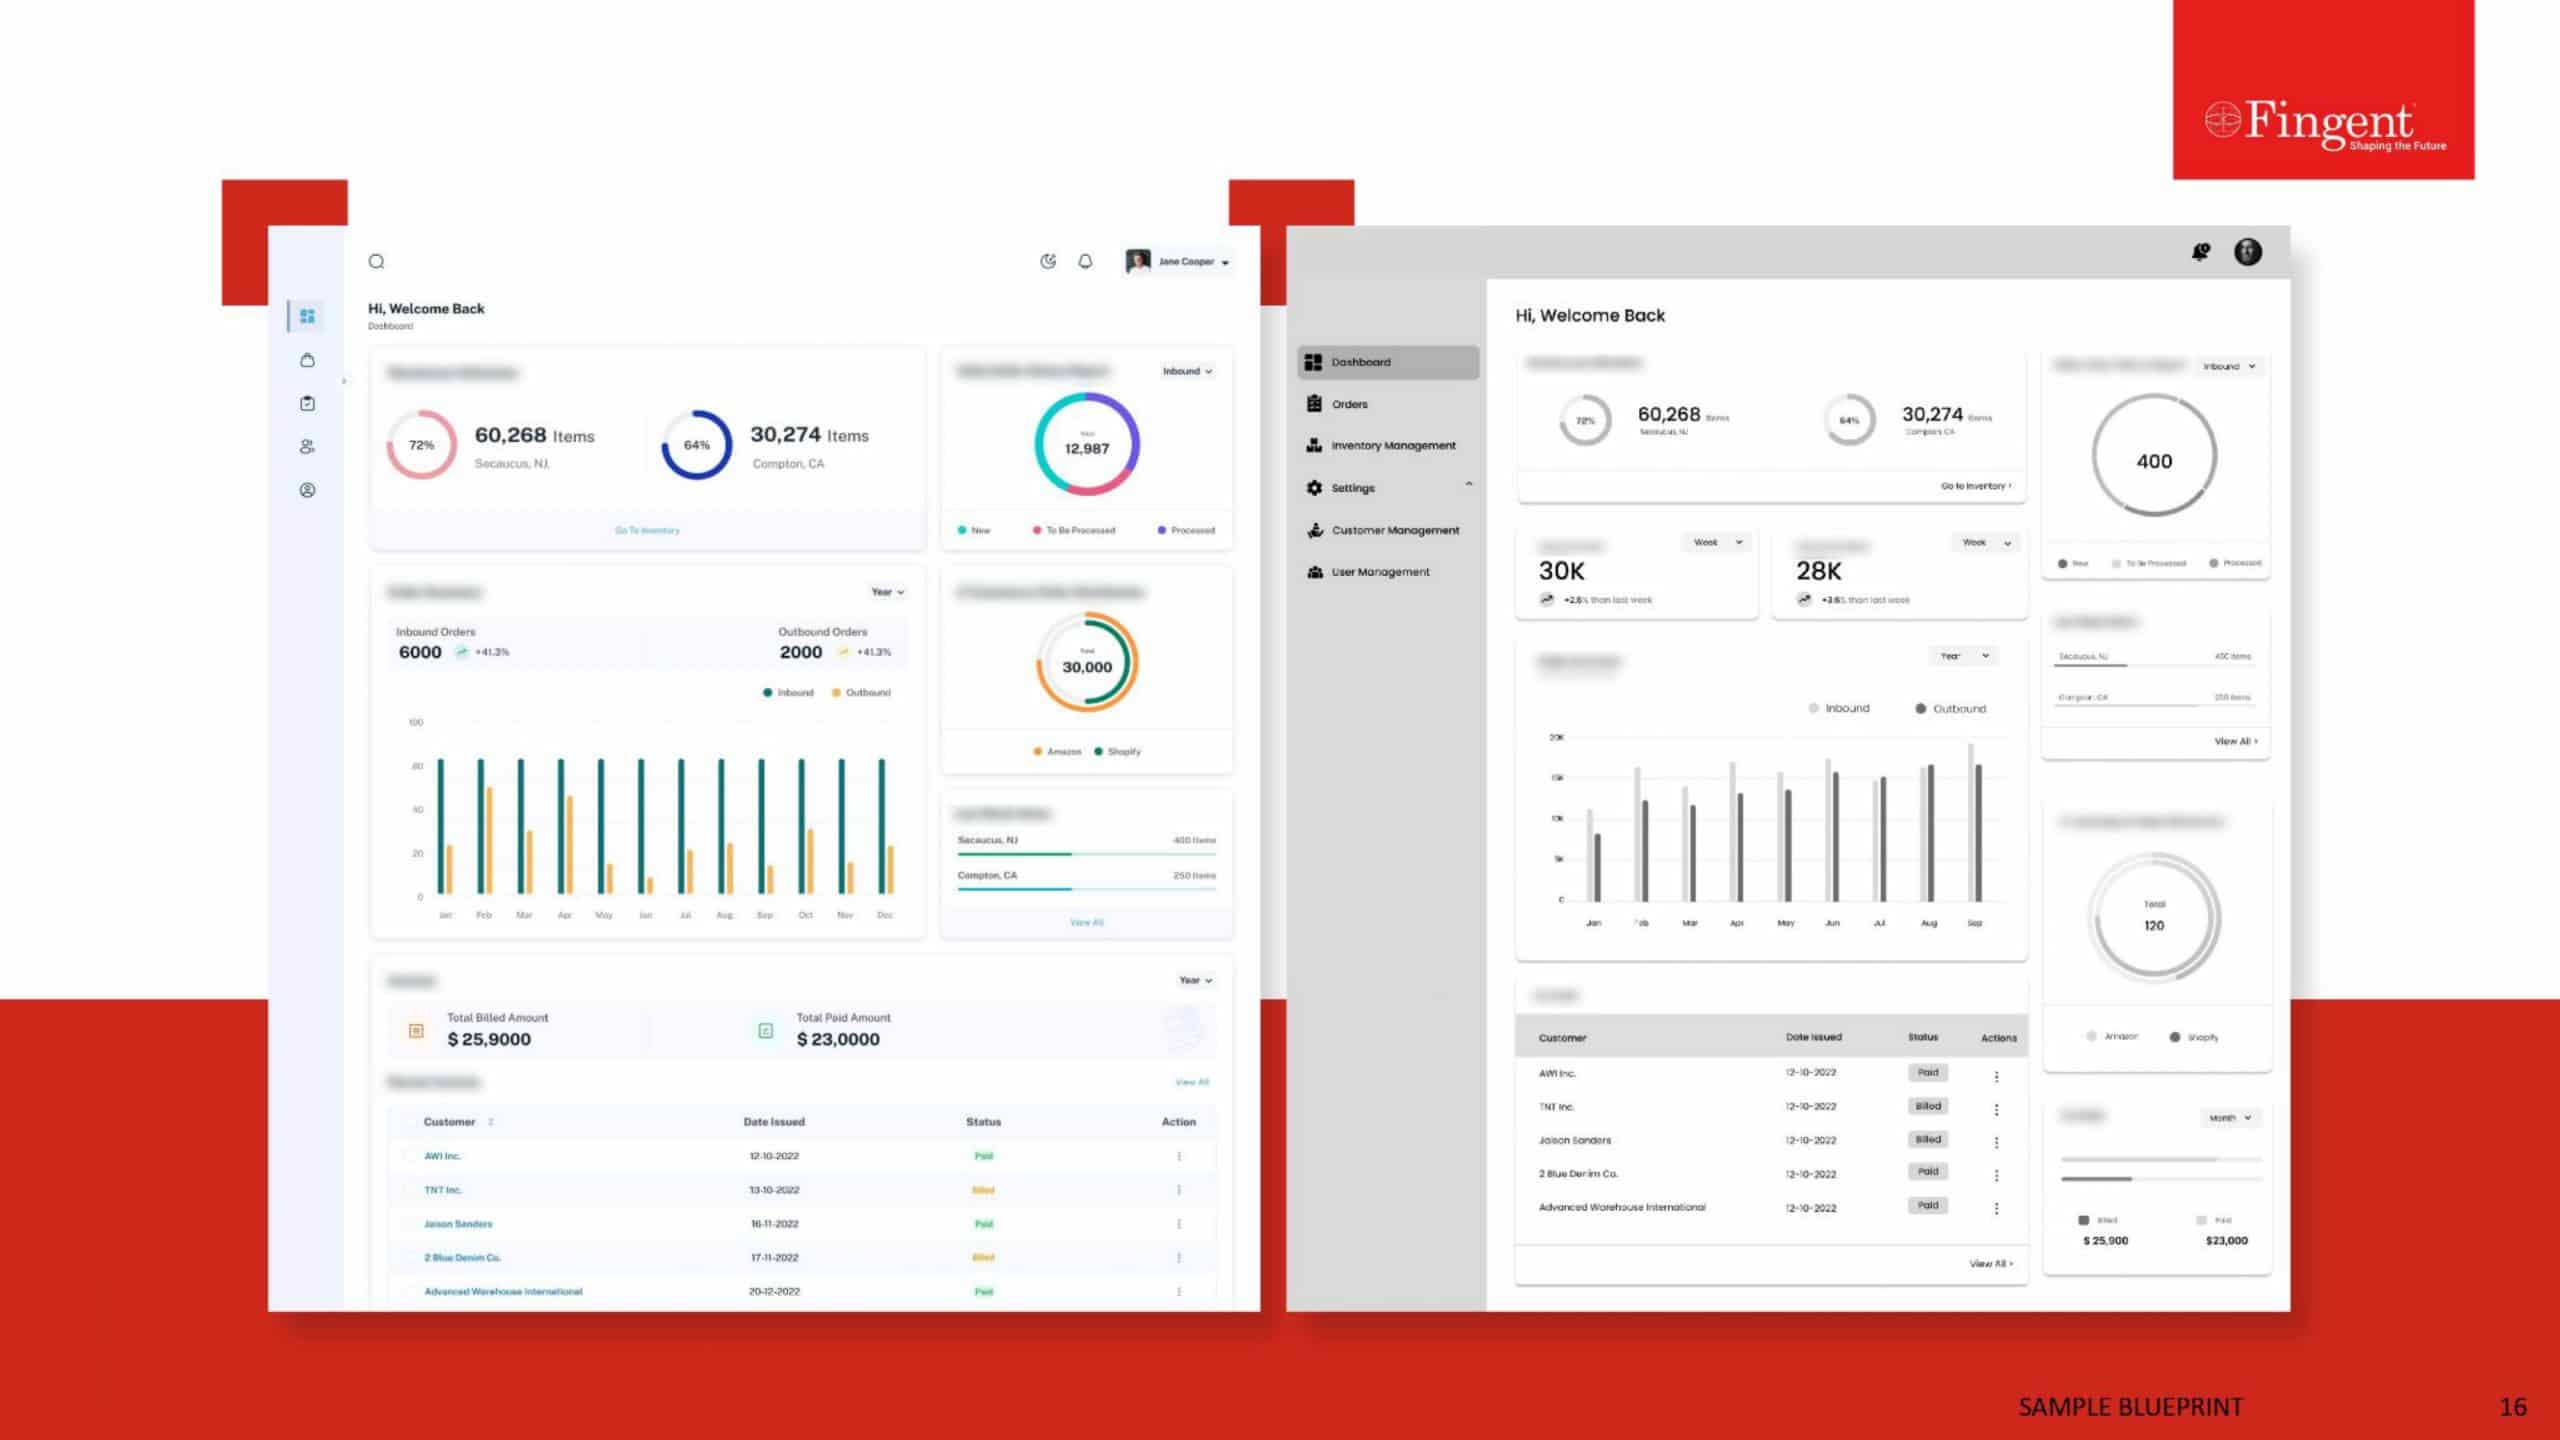
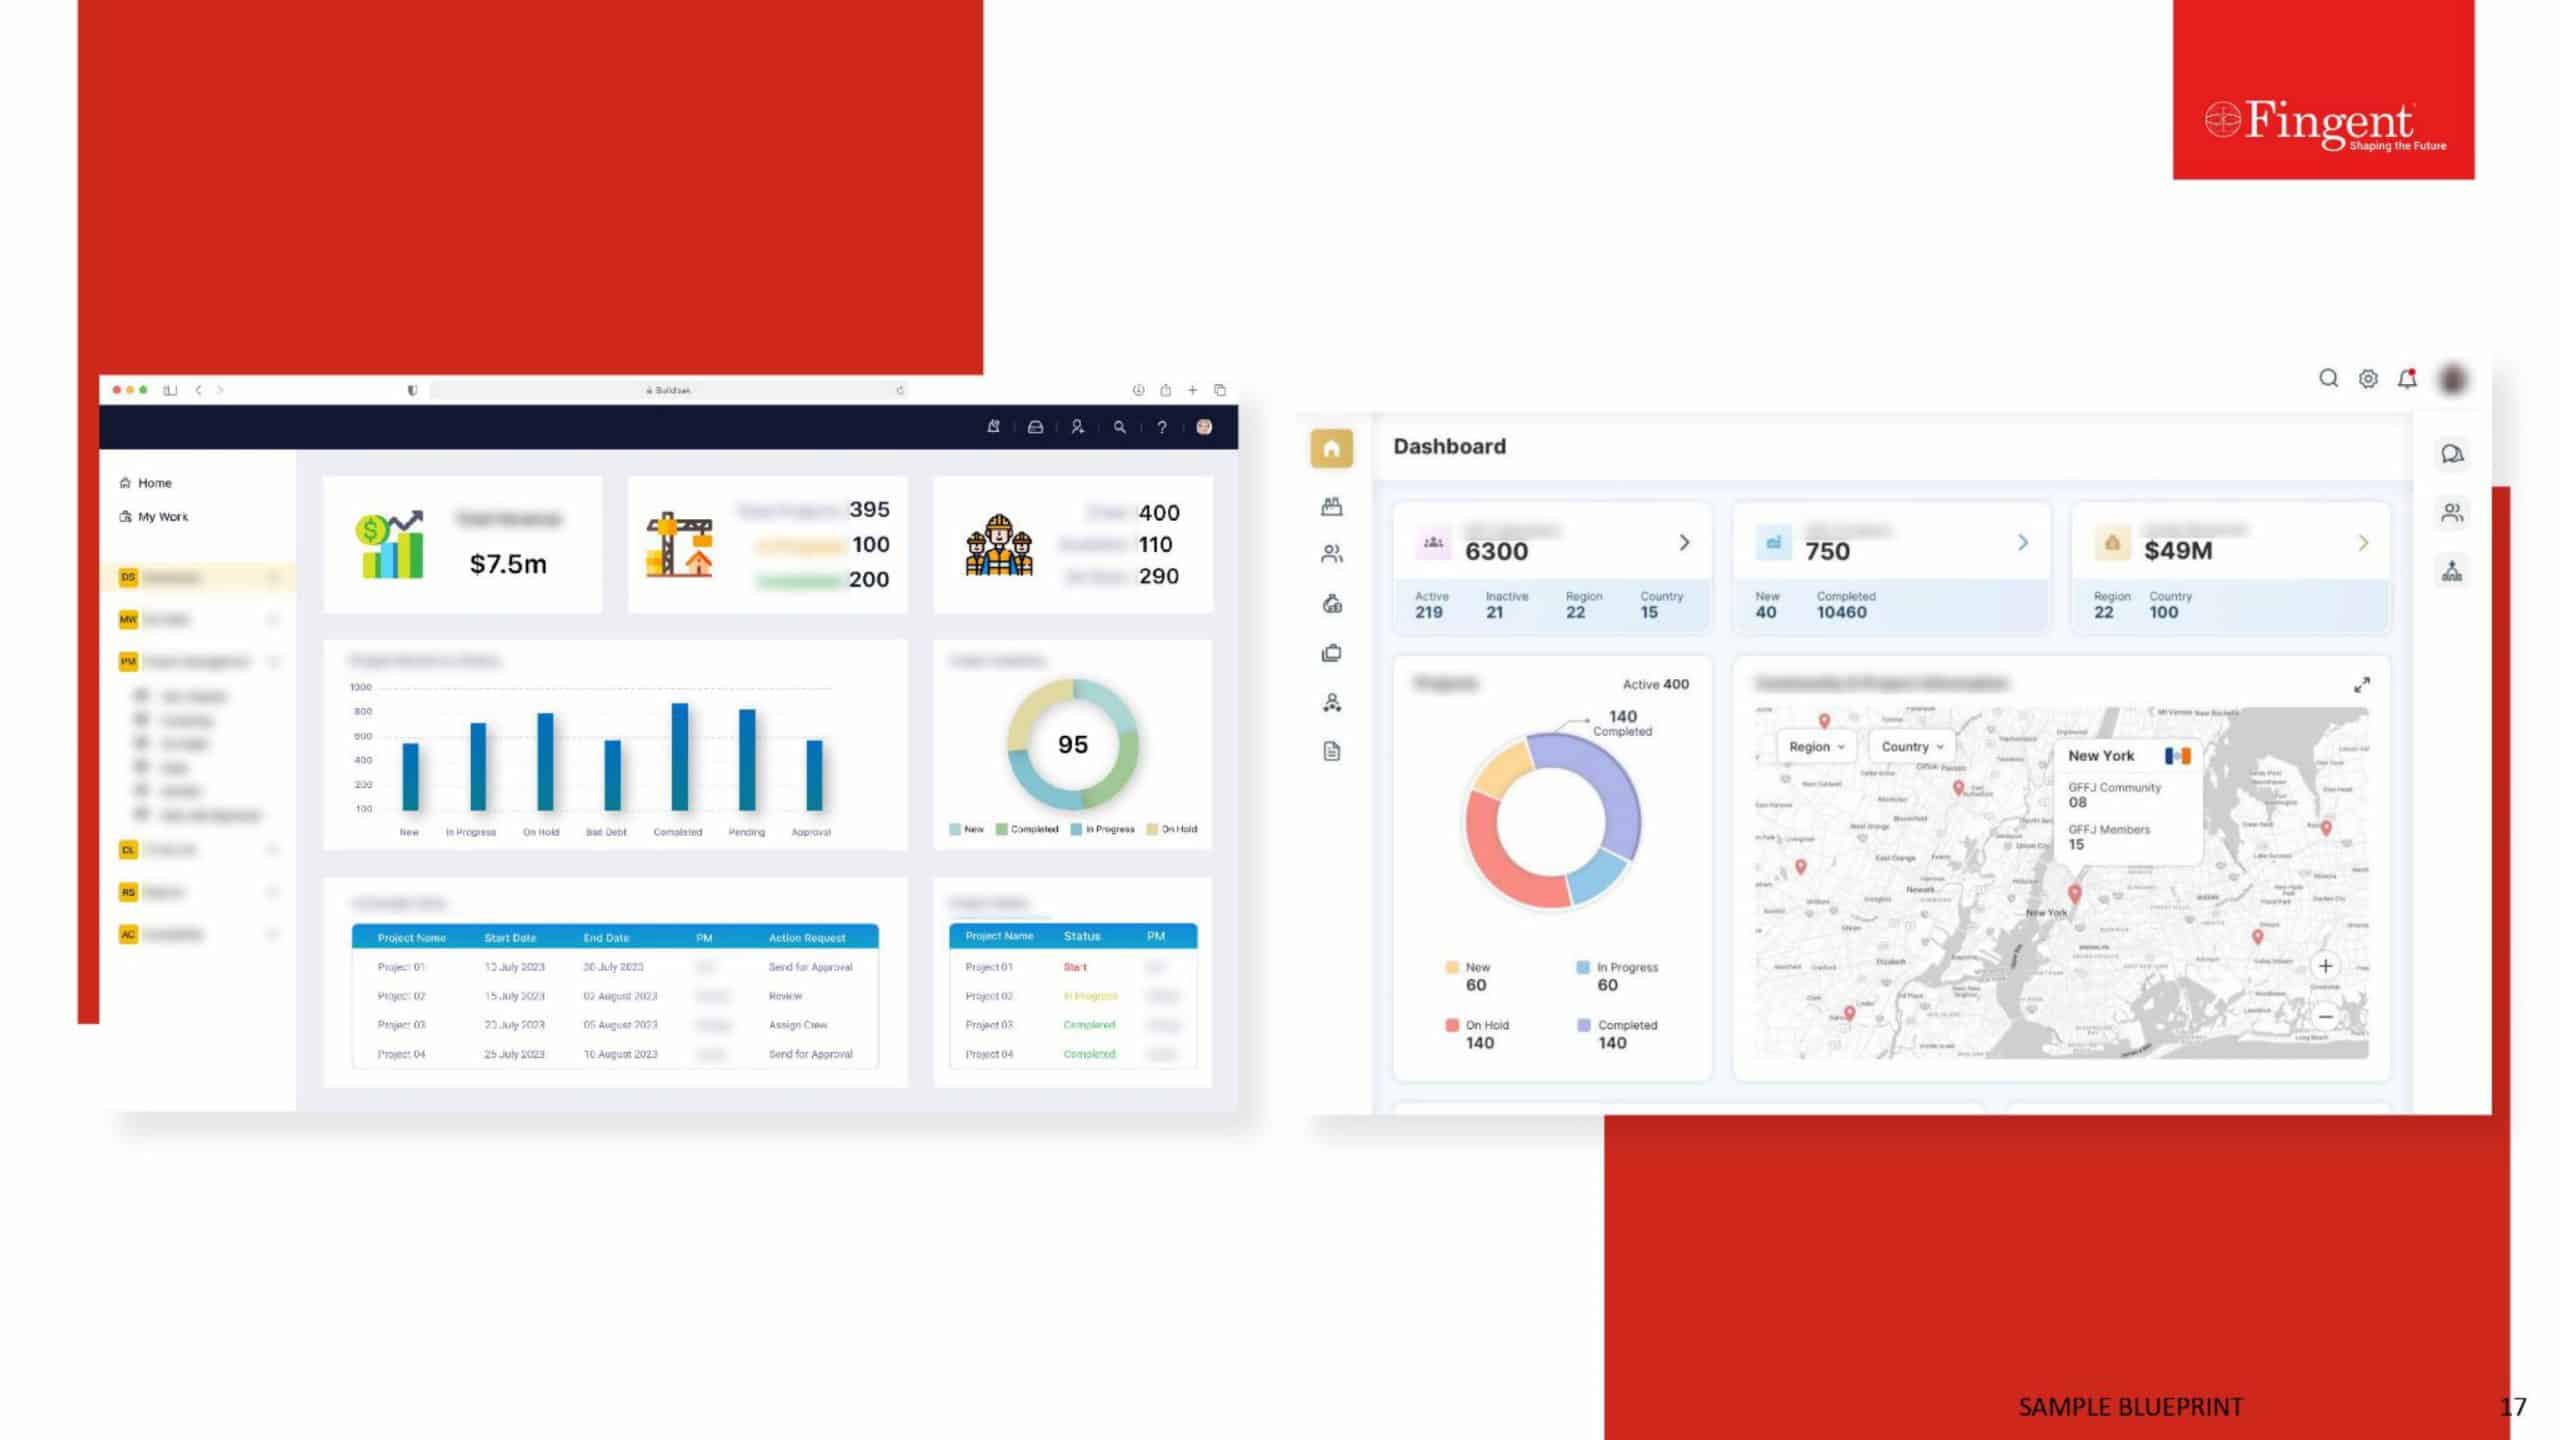
The rise of low-code/ no-code digital platforms is accelerating the shift to self-service analytics. These platforms empower non-technical business users to access data, garner insights and make faster decisions. Today, self-service analytics is improving business response, enterprise agility, speed-to-market, and decision-making. InfinCE, a low-code workplace orchestration platform enables seamless team collaboration by extending your ability to integrate multiple business apps. Its data-powered business dashboard software supports marketers and non-technical users to analyze data, glean insights, track KPIs, and make strategic decisions. As data becomes the key to unlocking business value, 2024 will see the democratization of data extending beyond the realms of technical analysts and data scientists to ensure better inclusivity.
5. XOps
The merger of development (Dev) and IT operations (Ops) has given rise to the “Ops trend.” The list of acronyms with the suffix Ops is expanding pretty fast. XOps aims to bring all these terms (DevOps, DataOps, MLOps, ModelOps, etc.) under one umbrella to advance automation and AI adoption, and minimize the duplication of technologies and processes. XOps enables data and analytics deployments to function effectively in tandem with other software fields. In 2024, more data analytics experts will start using XOps to operationalize and automate their processes in conjunction with the software development cycle. This eliminates data management and insights generation challenges from the very beginning of software development. XOps will augment the power of enterprise technology stacks to deliver high-quality on-demand analytics.
Read more: DevOps: Building a New Culture of Software Development and Delivery
6. Graph Analytics
Gartner estimates that by 2025, 80% of data and analytics innovations will be crafted using graph technologies. Graph analytics employs deep learning algorithms to correlate multiple data points (entities such as people, events, things, locations, etc.) scattered across various data assets by exploring their relationships. This offers businesses a holistic understanding of the market, customer segments, consumer preferences and behavior, logistics, and risks. Graph analytics improves contextual understanding which enables businesses to identify problems and address them faster. SAP HANA is a leading graph database that comes with built-in processing engines to perform context-based data search. It allows users to access the correct data quickly. In 2024, graph technology will be used widely in search engine optimization, fraud and identity detection, supply chain logistics, social network analysis, and so on.
Read more: SAP HANA Helps Unlock Massive Health Data
7. Small and Wide Data
Until 2020, historical data replicating past conditions was enough to train AI and ML models. Disruptions caused by the COVID-19 outbreak have made such past data obsolete. It means that data analytics professionals should find new ways to use the available data more effectively. “Small data” and “wide data” techniques reduce the volume of data required for training AI models and help extract more value from diverse and unstructured data sources. By 2025, 70% of organizations will switch from big to small and wide data, improving contextual analytics and making AI systems less data-hungry.
8. Decision Intelligence
Decision Intelligence (DI) is a data analytics discipline that analyzes the sequence of cause and effect to create decision models. These decision models visually represent how actions lead to outcomes by observing, investigating, modeling, contextualizing, and executing data. DI helps make faster and more accurate decisions that result in better outcomes. Gartner forecasts that in the next two years, one-third of large corporations will leverage DI to augment their decision-making skills.
9. Generative AI
Generative AI is an artificial intelligence technique that uses existing text, images, and audio files to generate new content. This technique proves to be highly useful in producing new and authentic data that mimics the original in data-scarce situations. Generative Adversarial Networks (GANs) and Variational Autoencoders (VAEs) are the two key technologies that support Generative AI. By 2025, generative AI will account for 10% of all data produced, up from less than 1% today, states Gartner. In 2024, Generative AI is expected to augment targeted marketing, drug development, and software code creation.
10. Natural Language Processing
If you’re using Google Assistant or Amazon Alexa, you’ve already experienced NLP in action. NLP supports data analytics in multiple ways by leveraging techniques such as speech recognition, machine translation, chatbots, text classification, sentiment analysis, and so on. It offers business leaders, marketers, salespeople, and researchers with the precise insights needed to make better decisions. Reports show that the rising demand for advanced text analytics is driving NLP adoption in sectors like healthcare, social media analytics, and consumer and market intelligence. 2024 will witness the rise of no-code and low-code NLP platforms that will make AI and ML more ubiquitous.
Contact us to know more!
Stay up to date on what's new

Featured Blogs
Stay up to date on
what's new


Talk To Our Experts
What is Exploratory Data Analysis?
Exploratory Data Analysis (EDA) is a statistical approach used to analyze data and produce descriptive and graphical summaries. Analysts may or may not use a statistical model, but EDA primarily foresees what the data can reveal to us beyond formal modeling.
With EDA you can analyze your data as it is, without the need to make any assumptions. EDA further validates and expands the practice of using graphical methods to explore data. EDA gains insights from statistical theories that give easily decipherable insights. Exploratory data analysis techniques can also be used to derive clues from data sets that are unsuitable for formal statistical analysis.
Exploratory Data Analysis displays data in such a way that puts your pattern recognizing capabilities to full use. The patterns are evident to an examination that is careful, direct, and most importantly assumption-free. Thus, you can understand relationships among variables, identify problems such as data entry errors, detect the basic data structure, test assumptions, and gain new insights.
Purpose of Exploratory Data Analysis
The prime purpose of EDA is to study a dataset without making any assumptions. This helps the data analyst to authenticate any assumptions made in devising the problem or operating a particular algorithm. Researchers and analysts can, therefore, recommend new schemes that were not previously considered.
In other words, you apply inductive reasoning to obtain results. These results may be in opposition to the theories that directed the initial data collection process. Thus, EDA becomes the driver of transformation. This approach allows you to oppose planned analyses and probe assumptions. The ensuing formal analysis can continue with better credibility. EDA techniques have the potential to uncover further information that may open new areas for research.
Role of EDA in Data Science
We need to understand the role of EDA in the whole process of data science. Once you have all the data, it has to be processed and cleaned before performing EDA. However, after EDA, we may have to repeat the processing and cleaning of data. The cleaned data and results obtained from this iteration are further used for reporting. Thus, using EDA, data scientists can rest assured that the future results would be logical, rightly explained, and relevant to the expected business circumstances.
EDA helps to clean the feature variables that are to be used for machine learning. Once data scientists get familiarized with the data sets, they may have to go back to feature engineering since the early features may be unable to serve the objective anymore. After completion of the EDA, data scientists obtain a feature set that is required for machine learning. Each dataset is generally explored using multiple techniques.
Read More: Top 10 Must-Know Machine Learning Algorithms in 2020
Methods of Exploratory Data Analysis
Exploratory data analysis is carried out using methods like:
- Univariate Visualization – This is a simple type of analysis where the data analyzed consists of a single variable. Univariate analysis is mainly used to report the data and trace patterns.
- Bivariate visualization – This type of analysis is used to determine the relationships between two variables and the significance of these relationships.
- Multivariate visualization – When the data sets are more complex, multivariate analysis is used to trace relationships between different fields. It reduces Type I errors. It is, however, unsuitable for small data sets.
- Dimensionality Reduction – This analysis helps to deduce which parameters contribute to the maximum variation in results and enables fast processing by reducing the volume of data.
Using these methods, a data scientist can grasp the problem at hand and select appropriate models to corroborate the generated data. After studying the distribution of the data, you can check if there’s and missing data and find ways to cope with it.
Then comes the outliers. What are your outliers and how are they affecting your model?
It’s always better to take small steps at a time. So you need to check if you can remove some features and still get the same results. More often than not, companies just venturing into the world of data science and machine learning find that they have a lot of data. But they have no clue how to use that data to generate business value. EDA techniques empower you to ask the right questions. Only specific and defined questions can lead you to the right answers.
Exploratory Data Analysis: Example with Python
Read More: Why you should migrate to Python 3
Suppose you have to find the sales trend for an online retailer.
Your data set consists of features like customer ID, invoice number, stock code, description, quantity, unit price, country, and so on. Before starting, you can do your data preprocessing, that is, checking the outliers, missing values, etc.
At this point, you can add new features. Suppose you want the total amount. You multiply quantity and unit price to get this feature. Depending on the business requirement, you can choose which features to add. Moving on, by grouping the countries and quantity or total amount together, you can find out which countries have maximum and minimum sales. Using Matplotlib, seaborn, or pandas data frame you can visually display this data. Next, by grouping the year and total amount, you can find out the sales trend for the given number of years. You can also do the same for each month and find you out which time of the year has shown a spike or drop in sales. Using this same method, you can identify further problems and find out ways to fix them.
Read More: How to Use Data Analytics to Improve Enterprise Sales Numbers
The key to exploratory data analysis is to first understand the LOB and get a good hang of the data to get the desired answers. Get in touch with us to know more about EDA.
Stay up to date on what's new

Featured Blogs
Stay up to date on
what's new


