Category: Data Visualization
Impact Of Data Visualization On Future Technologies
Data Visualization is no more art. With emerging cognitive frameworks, multidimensional imaging and intelligence; data visualization is opening new horizons in being able to visualize large chunks of complex data. Being the modern substitute for visual communication, Data Visualization has enabled easy decision making for businesses.
Data Visualization Impacts
Data VIsualization helps data to be understood in visually interactive forms such as patterns, correlations, graphics and so on. It delivers a better understanding of the business states and in developing patterns that provide solutions and insights. The impacts of Data Visualization are as follows:
- Display of critical data in visually interactive forms.
- Can display trends over any period of time.
- Can grasp large chunks of complex data in an easy visual form.
- Prevents chances of errors in decision-making.
- Helps in identifying key features that impact business results.
- Helps in developing a forecast for future steps to be taken.
Data Visualization – Why is it Important For Your Business and How?
It is a fact that 90 percent of the information transmitted to the brain is visual, and high-quality infographics are thirty percent more preferred than plain text. This figure implies how Data Visualization can be used to help your business achieve heights in today’s data-driven sphere!
Data Visualization benefits are as follows:
- Data visualization can cut short business meetings by 24%, reports American Management Association statistics.
- A report by Tableau, reveals that managers who use the tools for visual data recovery find the correct required data, whereas, 48 percent more than the others need help from their IT staff and other personnel.
- The advanced analytics capability of Data Visualization tools makes it 5 times easier in decision-making processes than their competitors.
- Specific business intelligence that has effective data visualization techniques, provide an ROI of $13.01 for each dollar spent, states report based on Nuclear Research.
Related Reading: Find what you need to ask and learn, before choosing your data visualization tool.
How Is Data Visualization Crucial For Big Data?
Data Visualization affects the approach of analysts who work with data. Getting more insights and being able to respond to issues more quickly are two among the numerous key advantages of Data Visualization. In addition to these, real-time support to customers and monetization of Big Data in Retail Banking are also made possible.
Data Visualization in the form of infographics and other visual tools allows businesses to run smoothly and also speeds up analysis processes. This is because, when in visual form, it becomes easier to view data rather than viewing on spreadsheets.
The future of data visualization with Big Data maximizes the potential and increases productivity by providing infographics that can be transformed into critical insights.
The Future Of Data Visualization
- Data On-Demand
There are 28 zerrabytes (a trillion gigabytes) of data that is being created every year. This figure shows how much data is readily available for anything and certainly everything under the sun. The devices that are interconnected with these multiple streams of data undoubtedly improves efficiency and is also intensely accurate.
- Data Storing Into Database With a Clear Purpose
The large chunks of data collected entirely need not be stored in the database. For this, data charts and animations using the relevant data were used.
For instance, Bloomberg has a system named Scatteract. With Scatteract, it is possible to read each pixel using the OCR (Optical Character Recognition) technique and convert data points from a particular image to data in tables.
Data visualization is said to be fully understood by algorithms as well in the near future.
Data Visualization With Virtual Reality – Virtualitics
There is nothing better than being able to communicate insights via interactive visuals in real-time. Augmented reality or cue virtual reality technologies are successful and efficient.
According to experts, the market size of augmented virtual reality is expected to be worth about $209 billion by 2022 globally. And the software market size for virtual reality is expected to be worth $6.4 billion by 2021 globally.
An example of virtual reality enhancing the future of Data Visualization is the ‘Project Night At The Museum’. It is a 3D based mobile-friendly observation of virtual reality like a museum that showcases the ‘space’ and so on.
When it comes to Virtual Reality And Augmented Reality, the technology called Virtualitics or even known as ‘Immersive Analytics’ provides visual control to viewers to explore data sets, Artificial Intelligence support or smart mapping support made possible by multi-dimensional data analysis.
Virtualitics provides a 3D collaborative environment which is used to link data with pattern recognition. This is used to retrieve various multi-dimensional relationships. For instance, Scatter Plots are a good example of 3D Visualization provided by Virtualitics. Scatter Plots help in combining different metrics together to form a single and simple graphics.
Related Reading: Find the right difference between data visualization and data analytics.
The Three Big Changes In Data Visualization
As Data Visualization is evolving at the technological forefront, there is a constant increase in the number of analytics tools. One set of analytical tools is the Rapid Prototyping tools and the other being Charting Libraries. The main three changes identified are as follows:
- Disruptive Tools: Disruption in Data Analytics and Visualization
- Application In Many Industry Verticals: Marketing Analytics, HR and Product Analytics, Manufacturing, Healthcare, Education, Finance, IT and so on.
- Cross-pollination of different people to join the field of data science: This is a cross-pollination of ideas from different sectors such as astronomy, arts, science and so on.
Related Reading: Read on to know about 7 amazing data visualization tools.
Data Visualization As An Investment
According to the recent Data Connectivity Outlook Survey by Progress, 59 percent of organizations said that they use Data Visualization techniques and it has profoundly converted into investment.
For instance, medical imaging technologies such as MRI scans, etc., have led to R&D companies that provide medical data visualization solutions.
IoT, AI, and machine learning are continuing to contribute to Data Visualization by being able to draw critical insights derived from these data.
Data Visualization is the easiest way to provide a clear picture to depict any complex data and to retrieve useful insights. To discover how Data Visualization can boost your business efficiency, reach out to our team of experts at Fingent, a leading custom software development company. Contact us now!
Stay up to date on what's new

About the Author

Featured Blogs


Stay up to date on
what's new


Talk To Our Experts
Step-by-Step Guide To Using Tableau In Data Visualization
Organizations now have access to more data than before. Earlier, data were not considered important enough and remained severely underutilized. Today, we witness a complete reversal, as data have become a pivotal element in innumerable processes governing an organization’s functioning. This value is not simply a result of procuring data on unclassified stacks, but assimilating them and gathering the needed insights that potentially bring about transformation.
Insights from data are made discernible and are put into plain view via dashboards. They bring into place a new way to understand complex data sets by projecting the values into visual forms like charts, graphs, bars, lines, dots, etc., known as data visualization. The process collates data in varied forms from a broader web of sources to unravel insights. To assist with this is a plethora of business intelligence tools that companies can utilize to visualize their data sets.
Tableau has emerged as a leader among business intelligence tools and stood out from other BI platforms, chiefly because of its powerful, interactive visualization dashboards that discern and quantifies complex data sets into easily understandable visual forms. Being a market-leading business intelligence platform, Tableau aids individuals, teams and organizations visualize and analyze their data. Its interactive dashboard allows analysts to engage with live data sets to get a better overview of the results.
Owing to its innovative and embedded analytics platform, Tableau has been featured as the best in its category by the global market research firm Gartner. Accordingly, Gartner’s Magic Quadrant for Analytics and Business Intelligence Platforms mentioned Tableau as a leader, consecutively for the sixth time based on its customer-focused innovation and real-world value in helping data-driven enterprises solve their business challenges right away.
Related Reading – Five Questions to Ask While Considering Data Visualization Tools

Fig. 1 – Gartner Magic Quadrant for Analytics and Business Intelligence Platforms, Source – Gartner
Tableau combines laser-focus, efficiency and feature-rich elements that determine how people see and understand data. All this comes integrated into a robust and scalable platform, that lets you harness data needed to run even the world’s largest organizations. What Tableau brings to the table is an interactive experience, where we can directly control or modify the data sets in real time to extract intelligent insights instead of just viewing them on the dashboard.
Tableau Dashboards
The worksheet, dashboards and layout containers constitute the three main elements of Tableau. The powerful dashboards integrated with Tableau remain one of its core components. It essentially simplifies the process of quantifying data through features like drag-and-drop and side-by-side comparisons. Such an approach towards understanding data allows more transparency in business processes, which lets you closely monitor, evaluate and forecast performance levels.
Together all the worksheets when combined together form the basis for a dashboard. Every single worksheet contains visualizations of data obtained from a range of sources, which can be grouped together to create a single dashboard. You can even include several dashboard objects that enhance the interactivity and visual appeal. Layout containers, whether horizontal or vertical perform the role of clustering objects together that helps change how the dashboard responds in accordance with user navigation.
Tableau’s dashboards also take visualization a cut above through its several built-in features like story points and device designer. They bring into the picture an overview of all the metrics and KPIs that define a process that helps with forecasting. Later on, a business can utilize these data to put up a comparison with the previous values and ascertain the effect of each action as well as find ways to improve them.
Related Reading: Business Intelligence Vs Business Analytics – What’s Best For Your Business
How to Use Tableau?
You just need to follow the below 3-step mantra to use Tableau:
- Connect to data
- Play around with the UI
- Create visualizations
1. Connect to Data
Connect to your data is the initial thing to do while starting to use Tableau. Connections mainly come in two types – to a local file or a server. Tableau can connect to almost any type of data server. Listed below are some of the popular databases that Tableau can connect:

2. Play around with UI
Once we import the dataset, a “Go to Worksheet” option is displayed next to the Data Source Tab at the bottom portion of the screen. A worksheet is a place where we create all of the graphs, so click on that tab to reach the following screen:
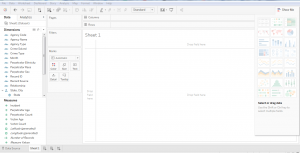 Fig. 2

Fig. 3 – Show me option in Tableau
3. Create Visualizations
Choosing the right visualization techniques for conveying insights in the most effective way is a challenging task. The below table will give you a brief idea about opting the preferred visualization method:

Insights from Using Tableau – A Typical Use Case
The working of Tableau is best understood through an example where there are different data types, each of which has the potential to reveal valuable business insights. Fingent helped one of their clients drive important business decisions by visualizing their secured and dynamic data based on their requirements.
Business need: Being part of an extremely dynamic industry, tracking the slightest changes in their ticket status is of the highest priority for the client. They needed a solution that will enable them to react quickly to varying stages of their tickets and to reduce damage. A solution that would be able to generate hassle-free, ad-hoc & secured reports for delivering accurate data visualization.
Solution: As per the requirements gathered, several dashboards and reports were designed for various levels by connecting to the Microsoft SQL server database. Refer to the screenshot below to understand how our client made use of Tableau to derive insights.
Member Dashboard Created For Fingent Clients
Member Dashboard consists of two tabs: Live tickets and Historic ticket. This dashboard visualizes the history data to derive insights for making better business decisions.
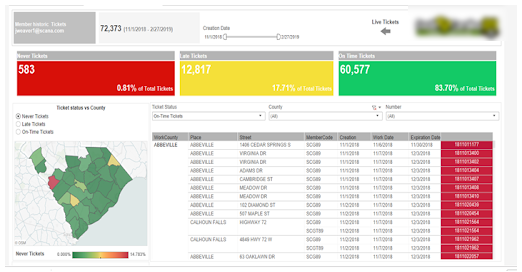
Fig. 4 – Member Dashboard
In this Dashboard, members can do a lot of analysis like the total number of different kinds of tickets, Ticket status vs County, cross tab with country wise ticket details and more. Interactive filters help the members to drill down into the dashboards with their needs for creating different subreports.
When members click on the live ticket icon navigation arrows, they are redirected to live tickets dashboard for the members.
Members view contains information formatted to aid facility operators responsible for locating. These would show at a high level how the user and its company are performing.
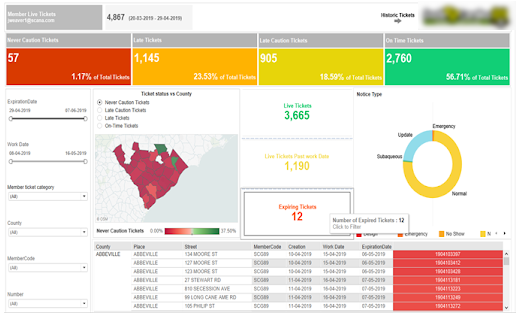
Fig. 5 – Live Tickets Dashboard
Excavator Dashboard
This dashboard view revolves around the person/entity who created the ticket. Excavator dashboard clearly helps track the lifecycle of tickets that are pending, need more attention, requires a positive response from the excavator, and those that passed the due time, etc. This dashboard also drills down the flexibility in each stage of the life cycle for better analysis and quick actions.
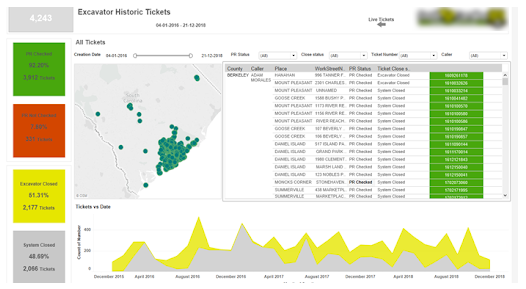
Fig. 6 – Excavator Dashboard
Damage Dashboard for Members and Excavator
This dashboard gives insights into the total damages occurred during the excavation in a plain and understandable way. Damage rate vs date, facility damaged over the years, country vs damages, damages by course, top excavation types causing damages, etc., are all covered in this dashboard.
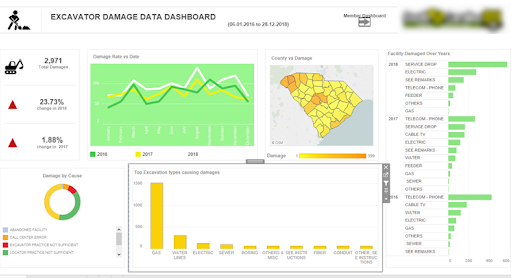
Fig. 7 – Damage Dashboard
The intention here is to give you an overview of what are the various business problems and questions, which can be answered using data visualization in Tableau and how it helped the client to drive business insights from the bulk amount of data in a synchronized way.
Related Reading – Power BI Or Tableau: The Better Choice for your Business
Conclusion
With more businesses going data-driven, the onus is on adopting a wider strategy for keeping data at the very center. Distilling insights from a mix of data obtained from a variety of sources is made easy with intuitive and easy to use BI tools like Tableau. The interactive dashboards in Tableau give rise to a new way to look at data by visualizing them, which refines our understanding of every single metric or KPI that is being displayed. Better accessibility into the dashboards and visualized data even from mobile devices further add to its flexibility.
Tableau comes inbuilt with some powerful BI tools that can do a host of other things alongside data visualization such as data stories, data analysis of workbooks, etc. With it comes the end result of churning out intelligent insights teeming with potential to bring about a transformation into the existing business processes. Besides, there is minimal effort required to start learning and using Tableau owing to its simplicity, easy navigation and other features like drag and drop interface. To sum up, Tableau fully redefines data visualization by helping companies leverage data for creating insights that drive business value. To know how your business can benefit from Tableau, get in touch with our custom software development experts now!
Stay up to date on what's new
About the Author

Featured Blogs
Stay up to date on
what's new
Talk To Our Experts
Did cell phones really help real estate agents? Yes, without any doubt. Cell phones did transform the industry by taking away all the limitations concerning mobility. Real estate agents were able to keep in touch with their clients irrespective of geographical barriers. Besides, agents can get in touch with their prospective clients while on the go and vice versa.
Technology has ushered in new possibilities in the real estate industry. Mobile phones constitute just one facet, whereas there lies a diverse array of technology tools and solutions capable of disrupting the real estate market altogether. As real estate is a people-focused business, more leads for a broker meant more sales. And real estate technology does bring in new ways to improve sales.
Being a real estate agent, thinking that technology will leave you jobless is entirely baseless. The truth is, failing to utilize the latest technologies will certainly make you lag behind and miss out on some of the huge benefits that await you. In fact, a recent survey by the real estate brokerage Owners.com reveals that home buyers are increasingly seeking technology-based tools from real estate agents.
With real estate turning more fast-paced and competitive, buyers are on the lookout for agents armed with real estate software tools to streamline the home buying process and help them make informed decisions quickly. In fact, the Real Estate in a Digital Age report by the National Association of Realtors (NAR) identifies several tech tools like social media, MLS site, brokerage’s site etc. apart from cell phones and email as catalysts to produce quality leads in a real estate business.
Related Read: How Realtors Are Winning Tenants With Innovative Mobile Apps
Real Estate Agents Still Holds Significance
We all know that nowadays a majority of buyers are doing most of their home search process themselves. Different mobile apps, websites, and digital platforms open up a wide range of potential properties based on the buyer’s interest. There are even alerts and notifications for new listings that exactly matches a buyer’s interest.
In a majority of the cases, we find that the buyers are doing most of the legwork when it comes to actually search for property listings. But that’s just an initial search and occupy only a small portion of the overall buying process. Once they find their listing, the buyer needs to call in an agent to physically get into the home and inspect it or even to draft a proper offer for submitting.
Even though it is clear that while buyers are increasingly adopting technology-based tools, they still require the guidance of a real estate agent to minimize delays and seamlessly guide the buyer to the closing process. Relying heavily on technology may present a risk, particularly in commercial property sales where the buyers are trading in millions. An agent’s expertise is highly sought after to effortlessly navigate the buyer and settle on the best listings that will guarantee high ROI.
Technology-based tools allow buyers to take some steps or responsibilities of the agents themselves. They can find the listings and close in the process without the assistance of an agent. However, it will never act as a full replacement for the expertise of a professional realtor.
Related Read: Real Estate Industry in the Digital Era
Technology is still inadequate to deal with several tasks that come under the work process undertaken by a real estate agent. From consolidating the list of documents to getting around the loopholes in placing offers and drafting contract term and policies, the role of a realtor gains the upper hand and stays relevant where technology fails.
According to a report by the National Association of Realtors, buyers still prefer working with a real estate agent for around 87 percent of the time to find properties worthy for sale or purchase. Many home buyers still rely on the advice from a trusted real estate agent when it comes to acquiring, selling or leasing properties.
However, technology tools clearly lack the ability to gauge specific information concerning a property such as its future value. Experienced realtors, on the other hand, can easily assess whether a highly rated property do carry any expected value and thus guide the home buyer to make an informed decision.
Technology will actually allow an agent to do an improved business. It enables an agent to better engage with their customers, optimize their business and zero in on deals that earn them the most profit. Besides, technology makes realtors more efficient, which helps them serve a larger client base with utmost satisfaction.
Digital transformation is now a key aspect of every sector. And it has been there with the real estate industry for years. The biggest trend now is probably the change in the mindset of agents by embracing technology to serve buyers who are increasingly tech-driven.
Technology Helps Realtors Serve in Many Ways Possible
As a real estate agent, what should you do?
As an agent, can you think of doing large volumes in a traditional way? You will find that it is really hard to extend services to your customers. However, technology can help agents serve a lot more people at the same time. Selecting the right technologies will allow agents to become more efficient – to serve more buyers in less time, resulting in more revenue generated.
Using a property management software can also help real estate agents make the buying process of their clients easier. With mobile apps making a big impact on the industry, agents are provided anywhere and anytime access to data and reports thereby extending more opportunities to share with their clients. The evolution of mobile apps has made it easier for both agents and buyers to communicate efficiently, schedule showings and meetings, and moreover make the entire process simpler. Besides, most of the apps available now are trying to organize things easier for agents.
Technology gave agents access to a huge amount of real estate data. These data can support the agents to take better decisions and will eventually provide them more opportunities. With the entire world shifting to data-driven practices, leveraging big data from real estate dealings and applying machine learning and AI helps make better recommendations and crunch out valuable insights that provide agents an overview to make clear and accurate decisions, which bring out more efficiency and revenue.
Related Read: How real estate technology helps predict property prices
If the buyers are performing their own searches, they get a better picture of the market, making things more realistic about what their budget will allow. On the other side, sellers will come to know what their properties are worth. But, they still need assistance to accomplish their goal of buying or selling, which means that technology will continue to revolutionize the market. However, when it comes to decision making, the customers will keep their trust with a real estate agent.
Down the line, agents who admit technology as a tool that can be adopted as a new way of conducting business and building successful relationships will ultimately lead the way. The key thing is to zero in on the right technology means that reaps true value. Teaming up with a sound technical partner having deep expertise in crafting successful technology solutions for the real estate industry will help identify and deploy the right one.
Related Case Study: Investing in PropTech solutions aids real estate firms streamline and digitize their existing processes. See how we came up with an innovative web-based application for a leading real estate brokerage to integrate their processes around a single platform here.
[Courtesy – Saïd Business School, University of Oxford]
Stay up to date on what's new
About the Author

Featured Blogs
Stay up to date on
what's new
Talk To Our Experts
Most of us, technology geeks or not, are eager to stay first in line to catch up with the latest game-changing technology trends. Here we are to know which technologies will thrive in future!
The Potential Technology Trends You Need To Explore In 2025
Have you ever looked up at the sky and clapped your eyelids on a bat? This is commonplace. But what if it was a drone. Or would it be a flying fleet? Since we don’t belong to the Jetsons family, the latter is not expected but we are close to it! This year is definitely a transformative year for technological innovation!
According to Gartner, the Top 10 Strategic Technology Trends for coming years are Block chain, Artificial Intelligence, Empowered Edge, Privacy and Digital Ethics, Quantum Computing, Immersive Experiences, Augmented Analytics, Autonomous Things, and Digital Twins!
This is just the tip of the iceberg. Following are the emerging technology trends and catalyzing technical innovation that we can expect to see more of in future!!
Related Reading: Find how digital innovation is transforming today’s business world.
1. Blockchain Technology – The ‘New Internet’
Some call Blockchain technology the ‘New Internet’. The blockchain is the brainchild of a person or group of people known by the pseudonym, Satoshi Nakamoto. It permits digital information to be distributed but not duplicated.
It was first devised for the digital currency, Bitcoin. It is also called the “digital gold”. To this day, the total value of the currency is nearly $112 billion US!
“Blockchain solves the manipulation problem”, says Vitalik Buterin, inventor of Ethereum.
2. Artificial Intelligence (AI)
Apart from AI-powered chatbots, This year will witness chip manufacturers such as Intel, NVIDIA, AMD, ARM, and Qualcomm shipping specialized chips that speed up the execution of AI-enabled applications.
This year will also be the year for hyperscale infrastructure companies like Amazon, Microsoft, Google, and Facebook.
Related Reading: Check out the top AI trends
3. Cloud-independent edge computing
The study from IDC illustrates that 45 percent of the entire data created by IoT devices will be stored, processed, analyzed and acted upon close to or at the edge of a network by 2024! Edge computing is a mesh network of data centers that process and store data locally before being sent to a centralized storage center or cloud.
4. Privacy and Digital Ethics
Facebook, recently witnessed the biggest security breach in which 50 million accounts were compromised. Facebook, later clarified that data of 30 million accounts were stolen.
People are becoming more nervous about how organizations and third-parties are using their personal data.
5. Quantum Computing
The world is behind building the first fully-functional quantum computer. Also called the supercomputer, this is expected to be a cloud service rather than an on-prem service. IBM is already offering cloud-based quantum computing services. For instance, the automotive, financial, insurance, pharmaceuticals, military, and research industries have the most to gain from the advancements in Quantum Computing.
6. Immersive Experiences
Conversational platforms are changing the way in which people communicate with the digital world. Virtual reality (VR), augmented reality (AR) and mixed reality (MR) are changing their approaches to know more about people’s perception.
7. Augmented Analytics
Augmented analytics relies on augmented intelligence. This uses machine learning (ML) to transform how analytics content can be developed, consumed and shared.
“Through 2020, the number of data scientists will grow five times faster than the number of experts”, says David Cearley!
8. Autonomous Things
Autonomous things, such as robots, drones, and autonomous fleet, use Artificial Intelligence techniques to automate their functions that were previously performed by humans.
9. Digital Twins
A digital twin is a digital representation of real-world items that are interlinked. Cearley states that there can be digital twins of people, processes, and things!
A DTO is an aspect of the Digital Twin evolution that is a dynamic software model that relies on operational or other data. DTOs help drive efficiencies in business processes.
Apart from these, there are other key technology trends that organizations need to explore in future. These include:
10. Cybersecurity and Risk Management
According to the estimates from the firm Gemalto, the data breaches were 4.5 billion in the first half of 2018! The University of Maryland study found that hackers attack computers every 39 seconds.
In coming years we will be facing a more sophisticated array of physical security and cybersecurity challenges.
Cybersecurity is thus the digital glue that has held IoT, Smart Cities, and the world of converged machines, sensors, applications, and algorithms operational throughout!
11. Smart Spaces
A smart space is a physical or digital environment in which humans and technology-enabled systems interact in an increasingly open, connected, coordinated and intelligent ecosystems, according to Gartner! The world of technology is to enter accelerated delivery of smart spaces in 2019.
12. Self-powered data centers
Data centers grow every minute with the implementation of virtual servers and storage, energy-efficient buildings. In coming years, the data centers are expected to run on its own self-contained power plants!
13. IoT integration
This year will witness more IoT implementation. An International Forrester IT survey that said among a recent group study, 82% of respondents were unable to identify all of the devices connected to their networks. Of this lot, 54% were nervous about device security, and 55% were concerned about integration!
Related Reading: Find the role of Data Analytics in Internet of Things (IoT)
14. More self-service IT kiosks for business users
This year will be a year of IT innovation designed to build better communication between IT and end users. The self-service IT kiosks to be set up would enable users to log on and choose what they want for the apps that they build.
15. The Internet of Things and Smart Cities
50 billion equipment, including smartphones, and others are expected by the IoT to be wirelessly connected via a network of sensors to the internetin future.
The term “Smart City” means creating a public/private infrastructure to conduct activities that protect and secure citizens. It integrates communications (5-G), transportation, energy, water resources, waste collections, smart-building technologies, and security technologies and services!
To upgrade your business with the latest technology trends on the table, contact the experts at Fingent today! Also, read through our latest blogs to learn more about accelerated technological development!!
Stay up to date on what's new
About the Author

Featured Blogs
Stay up to date on
what's new
Talk To Our Experts
Digital revolution has not just changed how businesses are perceived but also how businesses are performed. It meant a shift from the conventional means of operation to the one aided by technology. In today’s age, every aspect of a business from operations to management is run using digital tools. Such digital transformations has changed every industry and revolutionized the way of serving the customers, improve the competitiveness of the business and pushed forth its expansion into the global market.
Coleman Parkes Research in one of their surveys identifies that 82 percent of respondents have adopted digital technologies for redefining their businesses. This complete overhaul of business with the reinvention of business operations are affected by the advent of mobile, cloud, social, and big data analytics. So has the transcendence of a digital world helped grow businesses? If yes, what are the ways in which businesses can take advantage of the same?
Related Reading: Implementing a digital transformation strategy for your business requires adequate know-how of the varied process involved in the same. Know about the five crucial questions to consider before initiating your digital transformation journey here.
What are the innovative changes?
Early on, businesses built websites as a front for providing only information. With interactivity and the onset of the mobile revolution, sites and apps started to provide much more. They are used to offer services and products right at the doorstep of customers. The use of social media has enhanced the knowledge regarding what the customers like and what they seek. Businesses can use this medium to understand and tailor personalized experiences to provide real value to their customers.
Big Data analytics has changed the way businesses adapt and change. From decision making to predicting customer preferences and hiring the right skill sets, big data analytics has emerged as the game changer for businesses today by influencing how they deal their data. Instead of undertaking a market study, there is relevant data that tells what is working in the market and what is not.
The competitiveness
Each business that enters into a digital transformation is out there to compete every second. Imagine the new generation of customers who have everything at the tap of a button. Businesses need to be on their toes to deliver rich, real-time interactions with an element of personalization to keep their customers engaged. Also, the need to keep updating and innovating with respect to the competition is a necessity to save the business from running into the ground.
Read more: Fundraising Software For Nonprofits
The increased reach
Even though the competition increases with the digital transformation, businesses can take advantage of the fact that now they have reached a global audience. There is a market for the niche of products and services since customers have a way to access them easily. Also putting a step into innovation ensures that your business is at the forefront of achieving a profitable chunk out of the industry.
Improved avenues
Since transforming the business into a digital space is no longer an option, businesses should start utilizing the benefits of such a change. Pervasive digitization of services and products can be made to ensure that there are no barriers between the business and their customers. Also, traditional companies can start making efforts to revamp or add new services that are digitally available to increase their profits. Monetization from digital platforms and collaborations with partners can further help achieve better profits from an untapped source of customer relationships.
Related Reading: Take a look at the CIO’s opinions of digital transformation initiatives deployed across different businesses here.
How to make the most of this digital transformation?
In today’s day and age, no business is smaller or bigger, each of them competes in a virtual, digital space that offers fair ground for competition. Businesses should start looking at Big Data analytics and use the social media space to push their content to the customers. The idea is to be always supple, no matter how big or small your business is. Think like a startup at every step to understand the new technologies, the revolutionary changes, and be flexible to adopt them quickly. Having a digital core at the heart of your organization to manage and operate the business is the right way to go ahead in this modern digital era.
If your business is seeking to get into the race of digital transformation, it is important to act right now. Late adopters can have serious disadvantages since the competition is already in the domain. If you are looking to adopt a business model that utilizes a digital core, Fingent top custom software development company can help you to embrace the digital transformation with the best developers to get to the forefront of change.
Stay up to date on what's new
About the Author

Featured Blogs
Stay up to date on
what's new
Talk To Our Experts
The Healthcare sector is booming at a faster rate and the necessity to manage patient care and innovate medicines has increased synonymously. With the rise in such needs, newer technologies are being adopted in the industry. One such major change that might take place in the future is the use of Big Data and Analytics in the Healthcare sector.
According to an International Data Corporation (IDC) report sponsored by Seagate Technology, it is found that big data is projected to grow faster in healthcare than in sectors like manufacturing, financial services or media. It is estimated that the healthcare data will experience a compound annual growth rate (CAGR) of 36 percent through 2025.
Market research have shown that the global big data in the healthcare market is expected to reach $34.27 billion by 2022 at a CAGR of 22.07%. Globally, the big data analytics segment are expected to be worth more than $68.03 billion by 2024, driven largely by continued North American investments in electronic health records, practice management tools, and workforce management solutions.
Here are 5 ways in which Big Data can help and change the entire scenario of the Healthcare sector.
1. Health Tracking
Big Data and Analytics along with the Internet of Things (IoT), is revolutionizing the way one can track various user statistics and vitals. Apart from the basic wearables that can detect the patient’s sleep, heart rate, exercise, distance walked, etc. there are new medical innovations that can monitor the patient’s blood pressure, pulse Oximeters, glucose monitors, and more. The continuous monitoring of the body vitals along with the sensor data collection will allow healthcare organizations to keep people out of the hospital since they can identify potential health issue and provide care before the situation goes worse.
2. Reducing Cost
Big Data can be a great way to save costs for hospitals that either over or under book staff members. Predictive analysis can help resolve this issue by predicting the admission rates and help with staff allocation. This will reduce the Rate of Investment incurred by hospitals and in fact help utilize their investment to the max. The insurance industry can save money by backing wearables and health trackers to ensure that patients do not spend time in the hospital. It can save wait times for patients since the hospital will have adequate staff and beds available as per the analysis all the time. Predictive analytics also helps cut costs by reducing the rate of hospital readmissions.
According to a recent report by the Society of Actuaries, 47% of healthcare organizations are already using predictive analytics. It is also noted that over 57% of healthcare sectors believe that predictive analytics will save organizations 25 percent or more in annual costs over the next five years.
Healthcare & Big Data Facts: McKinsey & Company report states that after 20 years of steady increases, healthcare expenses now represent 17.6% of GDP, ie. nearly $600 billion more than the expected benchmark for the U.S. size and wealth.
3. Assisting High-Risk Patients
If all the hospital records are digitized, it will be the perfect data that can be accessed to understand the pattern of many patients. It can identify the patients approaching the hospital repeatedly and identify their chronic issues. Such understanding will help in giving such patients better care and provide an insight into corrective measures to reduce their frequent visits. It is a great way to keep a list and check on high-risk patients and offer them customized care.
Read more: Healthcare Technology and Mobile Apps
4. Preventing Human Errors
A lot many times it has been noted that the professionals tend to either prescribe a wrong medicine or dispatch a different medication by mistake. Such errors, in general, can be reduced since Big Data can be leveraged to analyze user data and the prescribed medication. It can corroborate the data and flag potential out of place prescription to reduce mistakes and save lives. Such software can be a great tool for physicians who cater to many patients in a day.
Healthcare & Big Data Facts: The Centers for Medicare and Medicaid Services prevented more than $210.7 million in healthcare fraud in one year using predictive analytics.
5. Advancement in Healthcare Sector
Apart from the current scenario, Big Data can be a great benefit for advancement in science and technology. For Healthcare, Artificial Intelligence, such as IBM’s Watson can be used to surf through numerous data within seconds to find solutions for various diseases. Such advancement is already in progress and will continue to grow with the amount of research collected by Big Data. It will not only be able to provide accurate solutions, but also offer customized solutions for unique problems. The availability of predictive analysis will assist patients traveling to a particular geographical location by studying similar patients in that area.
Healthcare & Big Data Facts: Effective use of big data could add $300 million per year to the healthcare industry.
Thus, to sum up, Big Data increases the ability of the healthcare sectors to:
- Predict Epidemics
- Cure Disease
- Improve Quality of Life
- Increase Preventable Care
- Begin Early Preventive Care
- Spot Warning Signs Sooner
Numerous studies and researches prove that technology has tremendously transformed the healthcare sectors. Professor and researcher Ronda Hughes too explains in her research how big data is improving health services.
Improving health outcomes with big data | Source : TEDxUofSC
Although most part of Big Data generated is not fully utilized currently due to limitations of the toolset and funds, it is definitely the future. Invest in the future and leverage Big Data Analytics to be a part of the evolving Healthcare Industry by partnering with Fingent, a top custom software development company with extensive experience in this domain.
Related Reading: Find out how big companies are using the power of Big Data to enhance customer experience.
Supercharge your field operations with ReachOut
Cloud-based field service platform to optimize service delivery for efficiency and cost savings. Schedule jobs, dispatch technicians, generate tickets, quotes, invoices & more.
Start Now
Stay up to date on what's new
About the Author
Featured Blogs
Stay up to date on
what's new
Talk To Our Experts
A 2017 study on the big data market worldwide showed that by the end of the year, nearly 53% of all companies had adopted big data analytics in some form to optimize business performance. The talent market too witnessed an increased demand for professionals with expertise in big data. We are the crossroads of a huge transformation exercise wherein data is the new oil. From wristbands to connected cars and automated factories, today’s enterprises deal with an enormous amount of data that they need to utilize for growth and innovation. This is true for any industry, be it financial, manufacturing, life sciences, or any other field. As the volume of data flow grows, the technology needed to manage and utilize it is in need of an innovative makeover.
The businesses of today need the next generation of custom software tools to harness the power of big data. They need to set up a technology backend that can support and supply data to multiple enterprise applications at different units in their businesses. Custom application development practices need to incorporate the changing philosophy of big data streams into their core operational procedures. Many organizations find it difficult to empower their software or technology team with knowledge on incorporating big data methodologies into their development practices. This is one of the key reasons why only 37% of companies have been successful in transforming into data-driven organizations, even though over 85% are trying to achieve this feat. So how can enterprises of today explore the power of big data using custom software development capabilities?
How to use Big Data to re-define your custom software development landscape
To answer the question, we decided to provide some tips for organizations to create valuable business results by incorporating big data into their custom software development cycle. Here are 5 ways to derive tangible business value from your investments in big data within software development.
1. Prepare for a mobile-first strategy
Over 50% of the US population owns a smartphone, and by 2020 it is expected that over 10 billion smartphones will co-exist with humans worldwide. No matter which industry you operate out of, if your customer-facing points do not have a mobile focus, then you are losing out to competition. By incorporating a big data philosophy, every custom software application that your organization builds will be able to handle data inputs from billions of mobile devices. This data can be analyzed, and insights can be used to direct content to mobile devices. And there is another scenario: if your business wants to be at the forefront of mobility, then tuning your custom software development practice to include big data concepts is a perfect way to get the heads-up on the competition.
2. Respond faster to customers
Your core business systems might already be engineered to provide support to your associates at customer facing avenues. With the velocity of requests coming in from diverse customer channels today– the internet, social media, physical POC’s, etc.– it becomes difficult for your employees to provide personalized attention to each customer. However, if your custom software development team is equipped with the skills to incorporate big data management trends within their development model, the resulting customer experience would be seamless. Ready-availability of information would help associates run the gamut of customer queries across channels simultaneously and with personalized attention. A faster response will pave the way for increased customer loyalty and will ultimately reflect positively on your business revenue.
3. Bolster automation efforts
From autonomous production facilities to automated email campaigns, enterprises worldwide are investing heavily in automating business processes. Productivity improvements, elimination of errors and biased decisions, efficiency, etc., are some of the key reasons cited. However, for each process within a business, the saga of automation can do wonders only if they are equipped to explore and manage all possible data points within them. This is where your software engineering teams need to see the bigger picture while building apps for every department. The applications need to be extensible for data flows from various sub-functions and units within teams. Only when processes and teams become data-driven will there be an opportunity to automate the process. Thus, having a big data approach in your custom software development practice will ensure that the future of automation in your business is moving in the right direction.
4. Set the tone for artificial intelligence
Just as in the case of automation, enterprises need to be data-driven if they are to incorporate transformative technology transitions like artificial intelligence. For algorithms to decide the future of customer experience, the first step is for these systems to learn about your customers and your business. This learning is facilitated by data insights that are generated by your custom software applications powering each unit of your business. Hence, by driving a culture of big data thinking within your custom software development team, the foundation for AI-enabled systems is well cemented into your base. Growing this in into future recommendation engines, conversational bots, autonomous business units, etc., will be a seamless activity.
5. Remain competitive in the digital era

This is a culmination of all that we have mentioned in the previous points. In an increasingly digital age, businesses can go down the drain in a very short time if they fail to innovate on the digital front. Data is the basic unit of every digital transformation initiative, and if your business isn’t equipped to generate and harness the power of data, then your chances of survival will be slim in the long run. This concept needs to be instilled at the grassroots level of your custom software development practice. Only if your business applications can handle the volume, veracity, and velocity of big data, will your business be able to serve the next generation of digitally savvy consumers.
Now that you know the importance of having a big data methodology in your custom software development practice, what you need to do is to start building awareness about it. Let your teams know the growing needs of the digital age and how data becomes the fundamental DNA of every business process. If your core business operations are not serving the tech industry, then it is best to have a solid technology consulting partner for your custom software development needs. Fingent software development company, we work with some of the world’s best businesses to deliver meaningful customer experiences with big data incorporated custom software development services. Talk to our experts today to learn how we can tap the hidden potential of your enterprise data.
Stay up to date on what's new
About the Author
Featured Blogs
Stay up to date on
what's new
Talk To Our Experts
IoT and data remain intrinsically linked together. Data consumed and produced keeps growing at an ever expanding rate. This influx of data is fueling widespread IoT adoption as there will be nearly 30.73 billion IoT connected devices by 2020. The Internet of Things (IoT) is an interconnection of several devices, networks, technologies, and human resources to achieve a common goal. There are a variety of IoT-based applications being used in different sectors and have succeeded in providing huge benefits to the users.
The data generated from IoT devices turns out to be of value only if it gets subjected to analysis, which brings data analytics into the picture. Data Analytics (DA) is defined as a process, which is used to examine big and small data sets with varying data properties to extract meaningful conclusions and actionable insights. These conclusions are usually in the form of trends, patterns, and statistics that aid business organizations in proactively engaging with data to implement effective decision-making processes.

Merging Data Analytics and IoT will Positively Impact Businesses
Data Analytics has a significant role to play in the growth and success of IoT applications and investments. Analytics tools will allow the business units to make effective use of their datasets as explained in the points listed below.
- Volume: There are huge clusters of data sets that IoT applications make use of. The business organizations need to manage these large volumes of data and need to analyze the same for extracting relevant patterns. These datasets along with real-time data can be analyzed easily and efficiently with data analytics software.
- Structure: IoT applications involve data sets that may have a varied structure as unstructured, semi-structured and structured data sets. There may also be a significant difference in the data formats and types. Data analytics will allow the business executive to analyze all of these varying sets of data using automated tools and software.
- Driving Revenue: The use of data analytics in IoT investments will allow the business units to gain an insight into customer preferences and choices. This would lead to the development of services and offers as per the customer demands and expectations. This, in turn, will improve the revenues and profits earned by the organizations.

- Competitive Edge: IoT is a buzzword in the current era of technology and there are numerous IoT application developers and providers present in the market. The use of data analytics in IoT investments will provide a business unit to offer better services and will, therefore, provide the ability to gain a competitive edge in the market.
There are different types of data analytics that can be used and applied in the IoT investments to gain advantages. Some of these types have been listed and described below.
- Streaming Analytics: This form of data analytics is also referred as event stream processing and it analyzes huge in-motion data sets. Real-time data streams are analyzed in this process to detect urgent situations and immediate actions. IoT applications based on financial transactions, air fleet tracking, traffic analysis etc. can benefit from this method.
- Spatial Analytics: This is the data analytics method that is used to analyze geographic patterns to determine the spatial relationship between the physical objects. Location-based IoT applications, such as smart parking applications can benefit from this form of data analytics.
- Time Series Analytics: As the name suggests, this form of data analytics is based upon the time-based data which is analyzed to reveal associated trends and patterns. IoT applications, such as weather forecasting applications and health monitoring systems can benefit from this form of data analytics method.
- Prescriptive Analysis: This form of data analytics is the combination of descriptive and predictive analysis. It is applied to understand the best steps of action that can be taken in a particular situation. Commercial IoT applications can make use of this form of data analytics to gain better conclusions.

There have been scenarios wherein IoT investments have immensely benefitted from the application and the use of data analytics. With the change and advancement in technology, there are emerging areas in which data analytics can be applied in association with IoT. For instance, actionable marketing can be carried out by applying data analytics to the product usage. IoT analytics will also allow the increased safety and surveillance abilities through video sensors and application of data analytics methods.
Healthcare is one of the prime sectors of every country and the utilization of data analytics in IoT based healthcare applications can provide breakthroughs in this area. The reduction of the healthcare costs, enhancement of telehealth monitoring, and remote health services, increased diagnosis and treatment can be achieved using the same.
The utilization of data analytics shall, therefore, be promoted in the area of IoT to gain improved revenues, competitive gain, and customer engagement. By collaborating with the right strategy partner, businesses can couple data analytics with IoT to leverage data for gaining a competitive advantage.
Monetize IoT Data with Analytics [ Source : TEDx Talks]
Stay up to date on what's new
About the Author

Featured Blogs
Stay up to date on
what's new
Talk To Our Experts
In this monthly insight post, we’re covering some of the major buzzwords in the world of enterprise software. We look at how AI can be potentially be misused in the enterprise, impact of machine learning on enterprise software, how technology can help legal aid services and how prepared are you to overcome the misuse of AI. We also look at how safe is crowd testing platforms for enterprises.
How Prepared Are You To Overcome The Misuse Of AI | CloudTweaks
The introduction of AI has been a great boon for enterprises. Compared to all other fields, the enterprise sector has remained open to all technological trends. However, the potential for misuse of AI still exists and is the one reason why you should be informed about it. This can help you take the necessary precautions to overcome the misuse of AI if it happened within your organization.
How Enterprise Software Is Getting Intelligent Through Machine Learning | Towards Data Science
Artificial Intelligence, Machine Learning, and Neural Networks have become the focal points of innovations and developments in computing. They have inched closer to achieving their full potential and are currently finding applications in almost every field of human activity from agriculture to transportation. Furthermore, this evolving forms in computing had a notable effect in the enterprise field too.
How Technology Can Help Legal Aid Services Run More Efficiently: a technologist’s view | Law-Tech
Using technology to serve legal aid is nothing new. A huge corpus of legal material and resources are available online. Emerging technologies enable legal aid services to become more efficient than ever before.
Are Crowd Testing Platforms Safe for Enterprise? | Technology Advice
As a much better alternative to outsourcing, crowd testing is an entirely different approach that still provides insights into the level of functionality and any possible defects in the software. Crowd testing puts QA testing into a community of freelance software testers and users from around the world, who evaluate the software and give timely feedback to the developers.
5 top facts how IoT integration is influencing custom software development | TechGenYZ
With over 28 billion connected devices expected to go live by 2021, IoT is all set to unleash a major shake-up to the internet as we know it today. The coming IoT wave will drown all areas of Information Technology. Custom software development is no exception.
Stay up to date on what's new
About the Author
Featured Blogs
Stay up to date on
what's new
Talk To Our Experts
From snake oil peddlers to the thirty-minute infomercial, we’ve seen it all when it comes to sales techniques. One thing is certain, though. Today’s consumers will not respond to “old school” sales practices. No longer will a “one-size-fits-all” sales approach work.
In a marketplace where consumers can have almost everything “their way” right away — from lunch to the day’s news — successful selling must be built upon an authentic appeal that resonates and offers a solution to a problem.
Seeking that authenticity and discovering that need doesn’t have to be difficult. Today’s most effective sales teams use data to market and sell effectively. McKinsey and Company surveyed more than 1,000 sales organizations worldwide and “found that 53 percent of those that are ‘high performing’ rate themselves as effective users of analytics.”
Customer data is a far more reliable business building tool than preying on someone’s emotions, using a fear tactic, or broadly throwing out a sales pitch and seeing what sticks. Here’s how your sales team can use it to serve existing customers, attract new ones, and make more sales to grow your business.
Discover your ideal customer’s most pressing need or pain point
Effective sales begin with a relationship. Gone are the days when a pushy, generic, persuasive approach produced sales. Today’s customer wants to be known and understood. They need a problem solved or a question answered. You’ll make a sale — and a long-term customer — when your product or service solves their problem or takes their pain away.
In “7 Old School Sales Techniques You Must Avoid,” HubSpot’s Marc Wayshak writes, “Prospects don’t care about your product or service. They only care about the problems you can help them solve. Instead of pitching your product, ask effective questions to discover each prospect’s deepest frustration. Then present a solution to solve that challenge.”
A basic survey tool can help you discover what your customer’s most pressing need is. Compiling all clients’ existing purchases within your CRM or marketing automation software and then looking for patterns can also reveal what problem buyers are trying to solve.
Sales reps should habitually keep notes on each client to document where the client is in the sales funnel, what transpired during the previous conversations, items for follow-up, and any personal info that becomes a topic of conversation.
Taking all of these information-gathering techniques together, you can compile the data to reveal your customers’ greatest need and many facets of it:
- Is it constant or occasional?
- What exacerbates it?
- What solves it?
Get to know your customers — who they are and what they like
Who is your target customer?
The more you know about your target customer, the more effective all your marketing and sales efforts can be. This type of data can help you become more focused on whom you serve, and therefore, can help you create a narrower offering.
The more specific your offering, the more likely your sales will increase, plus it’s a more efficient and economical use of your time, money, and resources. You know you are creating something that’s needed and you’re taking it right to the very customers who are desperate for it.
“Only focus on talking to prospects who are a good fit for what you have to offer,” writes HubSpot’s Wayshak. How do you figure out which prospects are a good fit? By examining the data!
Basic demographic data can help you pinpoint and create a highly receptive pool of qualified leads for your sales reps. Find out the basics about your customers:
- Age
- Gender
- Location
- Income level
- Interests
- Purchase history
Drilling down to figure out basic demographics helps you target advertising and craft specific messaging to make all of your sales efforts more effective. In today’s noisy world filled with non-stop marketing messages, yours will have a much better chance of cutting through to your intended customer if it’s tailored to their interests and needs.
Examine and predict buying behavior to retain customers and attract new ones
While criminal psychologists may disagree about the popular quote from TV talk show host Dr. Phil McGraw, “The best predictor of future behavior is past behavior,” it’s quite relevant when it comes to buyers in the marketplace. Data about your customers’ past behavior can be extremely valuable as you mobilize your sales team.
Statistics show that repeat customers are more likely to buy again. According to Marketing Metrics, “The probability of selling to an existing customer is 60 – 70%. The probability of selling to a new prospect is 5-20%.” When existing customers become legacy clients, that’s actually a boost to your bottom line. Customer retention is more valuable to your business than customer acquisition is. Frederick Reichheld of Bain & Company found that “increasing customer retention rates by 5% increases profits by 25% to 95%.”
Current customers’ experiences with your product or services can help you know best how to provide valuable customer service, which ensures a long-term partnership. This data is also helpful in reaching out to leads to nurture new client relationships.
Look at your clients’:
- Previous purchases
- Behavior before, during, and after a sale
- Lead origination
- Previous responses to specific messaging
After the data is collected
It’s also helpful to take the data from these three categories and examine them in light of one another. Where do they intersect or overlap? What patterns emerge? What questions about your customers are still unanswered?
The more you demand of the data, the more informed you’ll be about your clients.
And the more informed you are, the more effective your sales team will be.
Stay up to date on what's new
About the Author
Featured Blogs
Stay up to date on
what's new


