Retail is one of the most data-reliant industries globally. Inventory databases, customer details, POS systems, websites, social media data, and so much more provide rich data. However, to drive success, all this data must be converted into a dynamic, revenue-generating, and business-transforming asset. That’s where Retail Business Intelligence steps in!
Business Intelligence (BI) is especially prominent in customer service and inventory management. BI helps you organize, analyze, and contextualize business data in retail. It also offers performance measures and company trends, which help business owners make informed decisions. That is pure gold in today’s business environment.
Learn how Business Intelligence can transform your retail business in this 3-minute read!
Power Your Retail Operations With Intelligent Technologies.
Business intelligence is a type of AI that specializes in business functions. It helps users organize and manage businesses in a more efficient manner. In the retail industry, BI takes the big stage. Its superpower is the ability to automate almost any task. Retail BI has revolutionized the standard of business operations and customer satisfaction. These solutions can optimize assortments, sales trends, marketing campaigns, and more.
Currently, retail stores are also implementing BI and advanced algorithms. After all, a satisfied customer is the best business strategy. The BI solution can analyze demographic data, social media behavior, and purchase patterns. Using this information can enhance the customer experience. This creates a unique and personalized service, paving the way to customer retention and loyalty.
What are the Top Benefits of Using Retail Business Intelligence?
The worldwide BI and business analytics software market will reach nearly 17.6 billion dollars in 2024. There is a good reason for that. Business Intelligence powers business operations with valuable customer insights, optimized inventory management, and boosts marketing strategies. Listed below are the prime advantages of retail business intelligence:
1. Improves Business Operations
Optimization of business operations is the primary benefit of business intelligence in retail. It keeps a consistent record of everything happening within the company. This ensures that there are no errors due to an oversight of details or information. This is best seen in its ability to optimize the company’s inventory.
Retailers can use data analytics to process sales data on product demand. This allows them to make appropriate forecasts and predict upcoming trends. Furthermore, optimizing inventory management also involves preventing overstocking. This reduces inventory costs and enhances order management.
2. A Better Understanding of Customer Behavior
Machine learning learns from previous data to make accurate predictions. ML, as a subpart of business intelligence, enables retailers to study their customers. It collects information about the customers’ shopping habits and social media patterns. This data is vital to enhancing CX (Customer Experience) and optimizing marketing initiatives. Retailers can also use data analytics to create services that meet customer expectations. Analytics can help marketers draft customer progress maps, further providing insights about how to connect with the customer.
Let’s take a look at – How does Walmart use business intelligence?
Walmart being the industry giant, derives data from varied sources. The organization uses BI to analyze customer data derived from online transactions, in-store purchases, events, and more to drive intelligent insights. These intelligent insights reflect customer behavior, shopping patterns, and upcoming and fading trends. Such rich data can help determine the correlation between customers and various products, giving them more power to decide the shelf life of each product. Now they can effectively manage inventory, improve customer experience, and boost brand value, all while driving more revenue.
3. Helps Optimize Inventory Management
Inventory management includes storehouse activities related to product handling. Retailers face a variety of issues in this department. The issues range from tracking to overstocking. Investing in data analytics can help retailers deal with inventory management. These systems can maintain optimal stock levels and decrease inventory costs.
BI allows retailers to categorize their merchandise based on selective inventory control (SIC), which is also called ABC analysis. Here, BI analytics shows retailers the products that generate the most revenue. It segregates the inventory into three levels: A, B, and C. Level A is the most valuable, and level C is the least valuable.
4. Improved Merchandising
Business intelligence analytics can also recognize underperforming items. Using this information, retailers can optimize their product stock, which encourages them to find creative ways to promote these products. They can also opt to bring in new trending items and phase out stagnated inventory. BI can also categorize customers based on their sales patterns, which enables retailers to target promotions and pricing strategies.
5. Helps Optimize Store Floor Plans
Shopping can be a daunting process on its own. With the added hassle of unorganized floor plans, it becomes a nightmare. An ideal floor plan should help shoppers find products. It should also market new trending items to promote products. BI software can help business owners design a smooth floor plan. BI analytics works through various data sets and recommends insights. This determines if the selected floor plan has enough product types displayed etc. A good floor plan will make the customer’s shopping experience effortless.
Marketing has recently become intensively data-driven. This is due to so many social media tools and marketing platforms. To stand out from all the competition, businesses need to have a strategy in place. They should have access to useful insights into consumers’ purchase patterns.
With BI analytics, companies can gain impactful insights into their customers’ preferences. These insights further enable them to make smart marketing campaigns. This also promotes the right merchandise on the appropriate platforms. This way, retailers can use business intelligence insights to make their company strategies more effective.
Here’s a perfect case study. How does Amazon use business intelligence to improve customer experience?
Amazon uses business intelligence to segment customers based on demographics, purchase preferences, and browsing history. This helps them better understand their customers’ purchase patterns, choices, and trends, which powers their marketing strategies. Each of their marketing campaigns is, thus, personalized to target the segmented groups, in turn boosting customer trust, personalization, brand value, and sales.
7. Boosts Efficiency in the Supply Chain
Efficiency is the most important base in the retail sector. Like cogs in a machine, every business department needs to work in sync. This is the only way to meet optimal efficiency in supply chain management.
Real-time business intelligence provides top-notch tracking capabilities for supply chain operations. This allows retailers to recognize congestion and enhance logistics. Retailers can streamline supply chain processes and cut costs by running deep analyses. They can optimize inventory management, production procedures, and transportation data. All this is possible through the implementation of Power BI.
How to Transform your Retail Operations with Business Intelligence?
From improving operations and marketing to enhancing supply chain efficiency, retailers are using Business Intelligence in many innovative ways. They are also using BI to analyze market trends, track competition, and create targeted advertising campaigns, ensuring a competitive edge in the market. Here are some ways in which the retail industry uses Retail Business Intelligence.
1. Analyzing Venue Performance
Staying in touch with the floor is important. Retail BI analysis enables store owners to track floor functions. They can track foot traffic and use it to make many decisions. Metrics such as opening hours and site selection based on foot traffic are very useful.
Case in point: Lowe’s uses predictive analytics to deliver services to individual zip codes. This way, the right store gets the right type and amount of product.
BI stretches until rent negotiations. It gives insights into a center’s visitation. This includes data such as foot traffic and cross-shopping. A shopping center operator can use this technology to justify a rent increase.
2. Identifying Broader Market Trends
Foot traffic is also used to assess the local demand for products.
Case in point: Retail BI can analyze the regional markets to analyze the potential for new launches. A manager could use BI to analyze the relative performance of previous stores. They can then choose the right location for a new store.
3. Keeping Tabs on the Competition
The world of retail is very competitive. Keep an eye on your competitor and their performance. Compare your progress to theirs to help forecast future growth. Conduct a SWOT (Strengths, Weaknesses, Opportunities, and Threats) analysis if needed. It will reveal areas that need improvement. This will also help with budgeting and improve productivity.
4. Quantifying Cannibalization Risks
Location intelligence helps retailers reveal the physical reach of each store. These enable the store owners to decide where to set up the new store and where to reduce the store fleet.
Case in point: It can be used to optimize store performance by relocating it. Data analysis can show you the competition around you. It can also provide insights on better demographic fits for your establishment. In one case, relocation significantly improved business for a retail chain.
5. Creating Targeted Campaigns
Retaining customers and attracting new customers is the lifeblood of retail. BI helps by assessing customer information and providing insights for advertising campaigns. Foot traffic analytics applied to demographic datasets can also provide advertising insights. Businesses can use this power to create more bottleneck stores.
Case in point: Starbucks uses retail business intelligence software to promote products. The company lures customers into the stores with targeted advertisements. They have found a way to keep the existing customers loyal. They attract new customers simultaneously.
Power Your Enterprise With Fact-base Decision Intelligence
How can Fingent Help Drive More Success in Retail with BI?
Using cutting-edge technology, Fingentensures the best outcomes for your retail business. These technologies include machine learning, data analytics, and predictive analytics. Experts at Fingent can create a solution that will help your business make intelligent and well-informed decisions.
Here’s an example of how Fingent developed a top-notch solution for one of the leading retail enterprises. The solution tracks a customer’s digital journey across many milestones and delivers augmented experience insights. We have also created solutions for clients that can convert data sets into visual representations and automate data input procedures. Take a look at the complete case study.
Business Intelligence is revolutionizing the retail industry. Not embracing it will keep you behind! Give us a call, and let’s discuss how to make your retail business intelligent!
Stay up to date on what's new
About the Author
Tony Joseph
Tony believes in building technology around processes, rather than building processes around technology. He specializes in custom software development, especially in analyzing processes, refining it and then building technology around it.He works with clients on a daily basis to understand and analyze their operational structure, discover (and not invent) key improvement areas and come up with technology solutions to deliver an efficient process.
Augmented Reality in Retail: Use Cases & Business Benefits
Try Before You Buy: Creating Interactive Retail Shopping Experiences with AR
Imagine waking up to a record sales conversion on your eCommerce portal! Your customers are 20% more engaged and satisfied with the shopping experience. Your business gains boosted customer trust, brand value, and improved ROI!
Yes, it’s possible with Augmented Reality!
Augmented Reality in Retail is revolutionizing shopping experiences expeditiously! With AR in retail, customers can interact, customize, and engage with products better, so that they make the right purchase decisions. Nike’s Virtual View is one top example of how WebAR in Retail boosts customer engagement and trust!
But of course, it’s only natural to be a little skeptical before investing in any new business technology. That is why we bring you a detailed guide on what is Augmented Reality, and how your Retail and eCommerce firms can smartly deploy and benefit from augmented reality services !
Simply put, Augmented Reality (AR) superimposes digital content and information onto a user’s real-life scenario to enhance their virtual experience of the existing physical environment. The improved version of the physical world is attained by leveraging the capabilities of the computer-generated display, visuals, sound, text, and graphics which augments the user’s real-world experience.
AR will allow you to search things visually by simply pointing out mobile cameras toward objects in real-life surroundings. The Live View feature in Google Maps is a leading example of how AR allows users to visualize their destinations in the real world. Nintendo’s Pokémon Go App and the photo filters on Facebook and Snapchat are some of the popular examples of AR today.
However, AR is not just a gaming or navigational application. Several industries today, including consumer products and retail, are implementing AR to improve their operational and marketing abilities. Leading ecommerce brands, as well as in-store retailers, are highly investing in AR to build and deliver top-notch brand experiences.
By 2024, the number of mobile AR users will reach 1.73 billion.
billion
0
By 2024, the number of mobile AR users will reach 1.73 billion.
Why Is Augmented Reality Important In Retail and eCommerce?
Millennials are the core shoppers today, and they need services at their fingertips! Standing in long queues to grab that limited offer is off the trend! Now shoppers love to book it first online.
With Augmented Reality in Retail, online shopping experiences takes a new turn. Customers get to virtually try on items, customize and interact with the products better so that they make quick and smart purchase decisions. Getting complete satisfaction with online shopping increases brand trust immensely, giving retailers an immediate boost to expedite sales! The more reasons to implement AR in Retail!
0%
40% of consumers say they would pay more for a product that they could customize in AR.
What are the Latest AR Trends in Retail?
Today’s customers value personalization and convenience over pricing and product. Augmented Reality allows brands to develop smart retail experiences that influence their customers’ buying decisions.
AR makes online selling easier and more comfortable by creating virtual simulations for users to interact with a product, just like how they try a fashion outfit in a physical store. Using AR, retail customers can virtually visit their favorite brand stores, try products, and make comparisons, without leaving the comfort of their homes.
Top AR Trends in Retail Today
Improved In-store Experience
Shopping Sizeable Products
WebAR
Try Before You Buy
Experiential Marketing
AR Product Configurators
Improved In-store Experience
Improved In-store Experience
Using AR apps on mobile devices, customers can now quickly access product details, try out varied colors of the desired products, and make purchase decisions faster without actually trying each one out. The popular brand Lacoste gained much traction when they implemented this AR feature to bring their sports shoe colors to life!
Shopping Sizeable Products
Shopping Sizeable Products
Furniture and electronics brands are now highly using AR to improve their point-of-sales by letting their customers view the size, color, and look of the products in their selected space! Here’s a look at how Fingent, using web-based AR and 3D configurator, is making business smarter for retailers.
WebAR
WebAR
Make your website content interactive! Shoppers today dislike skimming through large content to understand product features. With WebAR, retailers can implement top AR features on websites so that customers can view the styles and fittings of clothes and accessories in augmented reality without downloading any further apps. ‘Nike Virtual View’ is one example of this brilliant feature.
Try Before You Buy
Try Before You Buy
Virtual try-ons powered by AR allow customers to try products without physically visiting the stores. Top eyewear and cloth stores are now letting their customers visualize how they look in different products right from home before purchasing them.
Experiential Marketing
Experiential Marketing
AR’s interactive visualization features enable retailers to entice a consumer from product consideration to product purchase through experiential marketing. Top beauty brands are now allowing customers to experience scientifically validated skin assessments and photo-realistic makeup simulations.
AR Product Configurators
AR Product Configurators
Retailers can create interactive product catalogs that display each product in a digital format that customers can explore. Nike’s sneaker configurator employs AR technology that allows customers to personalize their sneakers extensively by browsing product catalogs, is a fascinating example of this trend!
AR will enable retailers to deliver impactful, well-timed, and relevant user experiences that increase customer value, both in physical stores as well as in ecommerce!
Enriching Customer Experiences With Smart Malls Of The Future!
Right from parking to shopping to food, AR is reimagining mall experiences.
Notify your customers on their mobile about your top deals as they walk past your store!
Make mall visits fun for your customers. Add in some AR games to the mix!
Watch more on how your business can leverage AR for a unique and smart mall experience!
Why is AR a Powerful Retail Sales Channel?
By 2025, nearly 75% of the global population and almost all people who use social or communication apps will be frequent AR users. AR adoption will see growth in these four key areas:
But why use AR for retail?
Research shows the top reasons why customers return their products.
AR-integrated ecommerce websites and applications can run on any smartphone allowing customers to contextually experience every product at scale. Immersive product discovery experiences lead to better conversions as retailers can capture shoppers’ attention at the decision-making stage.
Brands that implement AR for Retail Sales will see:
AR offers shoppers innumerable options to interact with consumer products in a more personalized way. Customers aren’t anymore held back by a limited number of product images and videos. With AR, every single online session can be turned into a powerful sales channel.
Capture shoppers’ attention at the decision-making stage | Allow shoppers to personally interact with products | Turn online browsings into powerful sales channels
0%
32% of consumers use AR while shopping!
How Does AR Increase Sales in Retail?
AR use cases in retail are growing in leaps and bounds. Across the B2C, D2C, and B2B realms, AR will bridge the gap between online selling and the customer experience in the following ways.
AR can improve complex warehouse operations by streamlining warehousing management activities such as order allocation and picking, inventory control, material handling, and packaging. Using an interactive 3D warehouse layout, retailers can improve their warehouse planning.
Locate products and process orders faster.
Quickly extract necessary information (order number, trolley number, deposit bin information, passage numbers).
Expedite loading and unloading processes.
Achieve zero-delay deliveries through warehouse optimization.
Increases your sale orders and drives revenue.
Virtual Fitting Rooms
Virtual fitting rooms allow your customers to try on clothing items, jewelry, and other accessories even if they don’t visit your physical store. Even without touching an item, shoppers can see the size, style, and fit of apparel before they buy it. According to Shopify, an omnichannel shopping experience powered by AR nudges online shoppers to spend 10% more.
Superimpose the visuals of your items on live video feeds for your customers.
Create a virtual dressing room using Augmented Reality features.
AR-powered virtual mirrors can save valuable retail space in your brick-and-mortar stores.
Avoid the need to set up separate trial rooms.
Placement Previews
IKEA Place App’s AR feature allows customers to visualize how a new piece of furniture will fit their space. After selecting an item from IKEA’s catalog, the customer can point their mobile camera anywhere in their surroundings to see the furniture’s placement, adjust it from different angles, take photos, and share it with their friends for feedback.
The highly interactive preview experience keeps users motivated throughout the buying journey.
The seamless and fluid experience will encourage customers to return for more purchases.
This automatically boosts customer loyalty and brand recognition.
Guarantees conversion ten times more.
Route Optimization
Not just online and shopping experiences counts to customers. When products are delivered quickly and smartly, there are much more chances for a customer to build their trust in brands. With AR enabling effective navigation capabilities, routes can be optimized for seamless delivery channels.
Develop AR-powered apps that enable the delivery teams to plan their travel smarter.
Plan shortest route options, traffic updates, map views, and more.
Support your delivery partners with additional assistance just from their smartphone cameras, leading them to the right routes.
Ensure no package delivery goes missed or undelivered.
Interactive AR Packaging
AR-enabled interactive packaging offers consumers a highly engaging shopping experience that will boost ecommerce and in-store sales. Customers could scan a QR code on the retailer’s package to understand the latest offers and discounts, new product roll-outs, or read the brand’s story. Jack Daniel Distillery’s smart AR packaging allows users to take a closer look at their whiskey-making process and explore their growth story.
With AR, product packages aren’t throwaway junk anymore.
Encourage users to scan QR codes on food packaging to get exclusive recipes and cooking videos of top chefs.
Use interactive AR techniques to encourage shoppers to recycle packages and share their product experiences with others.
Interactive Business Cards
AR takes your plain business cards to the next level by allowing you to add 3D objects, interactions, animations, and powerful virtual components on top of your physical business cards. When you point your smartphone camera toward the card, you can see an interactive display of your business profile. AR allows you to incorporate numerous features into your V-card such as videos, audio, images, 3D objects, social links, animations, and URLs, besides your contact info and designation.
Stand out from your competitors and provide prospects with instant resources.
Increase curiosity and prompts your clients to access more information about your business.
Immersive and unique experiences in the real world improve your business’s credibility and doubles lead capturing.
Interactive business cards shorten the sales cycle and increase customer appointments and engagement.
Complete Product Information
AR allows superimposing additional product information that your customers may not get easily in physical or online stores. Processing product information is the most significant aspect that influences a customer’s buying decision. Customers want to know if the products they buy will fit their purpose. Top automotive brands such as Mercedes Benz and Hyundai use AR-powered digital car manuals to explain automotive features in a highly interactive way.
Digitally delivering the right information will simplify the product discovery process for the consumer, boosting sales.
Customers can avoid scrolling through large user manuals.
Pointing to a specific feature with mobile cameras will provide the necessary information required to impact the buyer’s decision.
The age of analyzing products via videos and images is gone! Customers now need more! With AR, realtors can bring their products closer to their customers, enabling them to interact with the items meanwhile establishing added brand value and customer trust!
Real-World Cases Of Boosted Customer Experience with AR
AR Taking Cabin Manufacturing To New Heights: Use Case
Complex designs, large customer requests, and inaccurate floor plans often challenge and restrict the operational efficiencies of shed and cabin manufactures. Leading players of the industry are now trying to implement modern approaches at each stage of their process to streamline functions and improve performance. How can AR help in this?
With a customized software solution featuring 3D web configurators
Customers can build and design their own sheds using AR
61% of consumers say they prefer retailers with AR experiences.
Augmented Reality vs. Virtual Reality
Many people use Augmented Reality and Virtual Reality interchangeably thinking that both technological concepts are the same. Though both AR and VR help creates immersive and interactive experiences, both are different in their own niches.
Augmented Reality
Augments the real-world experience of the user
Creates virtual experience by overlaying digital content on top of what the user is already seeing
Detects markers such as barcodes or QR codes to deliver AR animations to specific user locations
Explored best with smartphones
AR SDKs empower mobile apps to detect and capture real-time user environments
Reflects true-to-life conditions and real-life scenarios
Virtual Reality
Creates a fully-immersive virtual environment
Total immersion is accomplished by shutting the user from the real-world
Virtual Reality Modeling Language or VRML experiences delivered via a client-side interface to simulate virtual environments
Explored best with a VR headset
VR SDKs allow users to navigate pre-loaded and cloud-stored streams by using controllers and environment trackers
Virtual representation of real-life conditions
0%
Augmented Reality Boosts Online Shopping Sales Up To 200% - Forbes
Augmented Reality In Retail: Why Is It Picking Up Steam In Today’s Digital Age?
AR will boost your customers’ trust and drive their purchasing confidence.
Real-time product visualizations and virtual trials ensure that retailers are able to deliver products that match their customers’ expectations. AR reduces your marketing costs and increases your customer satisfaction.
AR retail experiences will eliminate the friction between sellers and buyers and maximize the probability of purchasing. When customers receive their orders as expected, it will decrease your product returns.
The rise in ecommerce demands delivering more successful online experiences. Retailers leveraging augmented reality can rest assured that they aren’t left behind in the competition.
Interactive virtual experiences arouse your customers’ curiosity and motivate them to explore your products. AR experiences such as virtual try-on persuade customers to come back and shop for additional products.
AR-enabled shopping experiences collect insightful data on customers’ shopping patterns, buying behavior, interests, and preferences. Retailers can use these insights to run targeted marketing campaigns and develop more personalized products.
The demand for contactless experiences triggered by the COVID-19 pandemic is here to stay. As people are more concerned about their personal hygiene and contamination risks, retailers can employ AR to connect with their customers and keep the show running.
Customers place emphasis on the value they get when buying from you. CX is the key brand differentiator that boosts customer loyalty today. With AR, you can optimize every customer touchpoint to deliver unmatched CX.
AR ecommerce apps can serve as your shop assistants and sales agents that take you through product features and benefits. You don’t have to hire expensive labor for showing the customer around, as AR does the heavy lifting.
0%
71% of consumers say they would shop more often if they used AR.
Fingent’s AR-enabled Applications for Retailers
Be it in-store or ecommerce, Fingent top custom software development company, enables retailers to deliver seamless shopping experiences to their consumers by leveraging technology to the fullest. Our AR retail solutions effectively bridge the gap between consumers and sellers:
1. Advanced In-store Experiences
2. AR Product Visualizer
3. Interactive User Manuals
1. Advanced In-store Experiences
Leveraging AR, we build powerful retail applications that offer shoppers an enriching in-store experience. Some of our top solutions include AR pop-up stalls that drive more foot traffic to physical stores, AR product guidance applications, web-based AR ecommerce apps that don’t require separate downloading, virtual try-ons for jewelers and cloth retailers, and AR visual merchandising to build buzz and brand awareness.
2. AR Product Visualizer
AR offers an excellent opportunity for retail shoppers to personalize their products by adding or removing features according to their tastes. Personalized experiences lead to better and faster purchase decisions. Consumers can view their selections in real-time and on a real scale to narrow down their choices. AR helps them overcome the common retail challenges such as mismatch of color, size, fit, design, material, and quality. For instance, they can choose the right washing machine by examining its features, color, front load or top load, energy usage, and so on.
3. Interactive User Manuals
Virtual technicians and interactive user guides that display operation instructions using AR will simplify complex product installations and configurations. Using a smartphone camera, users can explore the features of an electronic device, a vehicle, or a coffee machine. By superimposing computer-generated displays on top of the user’s view of the product feature, AR will help them understand the product demonstrations and instructions quickly. Users can verify if they are executing each step correctly and follow the simple DIY troubleshooting tips to ensure that the product functions well.
Augmented Reality Reshaping eCommerce!
Bring showroom-like experiences to your customer’s fingertips.
No more restrictions on a wide range of product displays.
Let your customers interact with your products and customize them right from the comforts of their homes.
What more on how you can smartly and seamlessly deploy AR for your eCommerce!
How Fingent Can Help Your Business Build Intuitive Apps With AR
With our expertise around ARKit for iOS Platforms, Spark AR, Lens Studio, Vuforia, Web AR Solutions, and AR Core for Android Platforms we help create powerful user experiences that fetch a competitive edge.
eCommerce
Bring the “Wow” factor to your eCommerce with virtual try-ons, preview placements, AR filters, and more!
Healthcare
We help you deploy AR to improve medical training, pediatric MRI evaluation, venipuncture procedures, dentistry, and more!
Equipment Maintenance
With AR connect faster with your machines to work smarter at reduced costs, and effective time management.
Augmented Reality streamlines retail operations to make shopping easier and convenient for both online and offline buyers. AR replaces physical fitting rooms with virtual try-on solutions and allows consumers to configure products based on their preferences. AR modernizes retail marketing through personalized content delivery and offers contactless purchasing options which will boost online sales.
3D product visualizations and “try-before-you-buy” digital experiences allow retailers to reduce the cost of returns that affect their ROI. Retailers can develop 3D animations and visual simulations to improve consumer awareness and influence buying decisions. AR helps retailers analyze customer behavior, test their product samples, boost brand engagement, and augment sales.
Full-fledged 3D experiences can improve product research and discovery which will result in more sales. Retailers selling automotive, home furniture, consumer electronics, and lifestyle products can drive traction and make unique selling pitches through AR. Studies prove that AR increases the average product (images and videos) viewing time from 30 seconds to eight minutes. Linking purchasing decisions with the shopper’s emotions will eliminate their doubts about the product and increase your sales volume.
According to Snapchat, 76% of consumers believe that AR will play an integral role in future shopping, with 57% of consumers planning to increase their AR usage in post-COVID times. AR improves a retail brand’s discoverability and increases a consumer’s likelihood to purchase after an immersive experience. AR experience educates and motivates customers at multiple points in the shopping journey, thereby influencing their purchasing decisions.
Today, every retailer needs to pursue an omnichannel retail strategy that revolves around customer-centricity. This requires retailers to personalize their offerings in the best way possible. AR can simplify your personalization efforts as it’s a highly user-centric technology that tremendously transforms the way you market and sell. Augmented retail strategy improves both your business’s bottom line and customer experience.
Modernization is a desire to stay relevant and grow. App modernization does just that for businesses. It enables them to stay relevant and grow. In line with that, organizations worldwide are scrambling toward digital transformation. How does that benefit businesses?
App modernization or updating older software for newer computing approaches extends the lifespan of an organization’s applications while allowing it to take advantage of technical innovations. It is like renovating an old house to improve efficiency, safety, structural integrity, and more.
However, there have been occasions when the app modernization project has failed. This has been a concern to most business owners considering digital transformation. Are you one of them? If so, through this blog, you can learn why and how to avoid app modernization failure.
First things first. Does your company need app modernization? If so, why?
Why Your Company Needs App Modernization
Apart from what we discussed earlier in this blog, app modernization integrates new features to keep up with the latest business requirements. Even so, many business leaders wonder if their business needs app modernization. Here is a list of specific reasons for you to consider:
It allows you to create new features and services that align with your current business needs and goals. In addition, you can personalize these features to ensure long-term value creation.
Educating new and older employees becomes easier as app modernization can automate tedious and repetitive processes.
App modernization helps you leverage the benefits of the cloud environment, allowing you to provide fast and efficient customer service.
App modernization allows you to add newer features, services, and functions. These, in turn, increase customer satisfaction leading to increased revenue.
Why, then, does app modernization backfire at times? And how can you ensure the success of the project?
When an app modernization project fails, it may pose serious problems for your business, including wasted resources and time. Failed app modernization may hinder agility and keep your business from capitalizing on modern technology. It was noted that an alarming 79% of app modernization projects still fail. Why? Surprisingly, the failure is not due to the new system or methodology, nor caused by the modernization vendor. The reasons are much deeper. Here are the top 5 reasons why app modernization projects fail:
1. Ignoring the business process
Modernization efforts fail when the business process (accounting, inventory, finance) is poor, and a business tries to correct it with new systems. That will never work. Businesses must first understand what is slowing them down. Determining the problem is the right foundation for successful app modernization.
2. Implementing new systems without considering drastic business changes
When entirely new systems are implemented without considering the drastic business changes, the employees are forced to adapt quickly. In addition, such practice forces the business to evolve to fit the new software. Instead, the software must adapt to fit the current business process and requirements.
3. Businesses mistakenly assume that they are ready for a complete revamp
Most businesses believe that they are ready to replace the old system with new systems, and the business will run better. Now that is a huge mistake. Completely replacing all systems can send your business and your employees into shock. It may even change how customers interact with the business. A better approach is to modernize in calculated steps.
4. Failing to adopt an agile software
The pandemic helped us see that agility is king. Adopting inflexible applications can have disastrous consequences on your business. If you want to be future-ready, replace rigid applications with agile applications.
5. Failing to consult the end user
Modernization projects that do not involve the IT department and the end user fail as they do not consider how the new solution fits business needs.
The Secret to A Successful App Modernization Project Journey
Every business that embarks on a modernization project journey faces many challenges. The success of your app modernization efforts comes down to two key components: your IT team and your employees. As teams go through this journey, use these secrets to avoid failure and ensure success.
Secret 1. Build a cross-functional team
When choosing a team or developing an innovation group, build a cross-functional team that can focus on developing the culture, process, and tools needed to improve the modernization process.
Secret 2. Toss it, sort it, and commit to it
An effective business principle is to welcome all ideas and sort them, but when a decision is reached, you must commit to it and execute that above all else. Doing so will ensure the progress of the project.
Secret 3. Map out the development workflow
Mapping out a development workflow can help you when you encounter complexities in the project. It helps you look at every tool being used and identify dependencies.
Secret 4. Set milestones
Projects may change. Setting small modernization goals will help you adjust your long-term plans and reduce engineering risk. Focus on many small steps when planning for a major milestone. Doing so will ensure smooth progress from one step to another.
Secret 5. Prioritize data into categories
If you prioritize data into high, moderate, or low categories, you can decide what safeguards to have for each category.
Secret 6. Do not sew a new cloth on an old cloak
Take a hard look at your development workflow and identify habits that could derail your app modernization process. Don’t just patch up old problems with a new tool. Remember, these problems can derail new tools, so don’t patch, fix.
Secret 7. Keep your team in the loop
Your team may find it challenging to develop the knowledge they need to work on the new tools. Keeping them informed about the new tools and training them to navigate new workflows can ensure the success of application modernization.
Several aspects may factor into a successful modernization. That is why modernization endeavors are so challenging. However, implementing the above secrets can help the success of app modernization efforts.
Tony believes in building technology around processes, rather than building processes around technology. He specializes in custom software development, especially in analyzing processes, refining it and then building technology around it.He works with clients on a daily basis to understand and analyze their operational structure, discover (and not invent) key improvement areas and come up with technology solutions to deliver an efficient process.
AI is not just a technology; it has become part of daily lives. Thanks to AI, we witness new kinds of development in each sphere of life every day. We can access many points with AI now more than we could ever before. From the research that we do on the internet to the goods that come to our doors, AI is directing our lives and business. It has solved many problems faced by humanity. And, revolutionized technology in all industries.
Coined at Dartmouth College in 1956, Artificial Intelligence (AI) gave succeeding generations a potential for information technology that can benefit humans in a profound way. Apart from bringing efficiencies, AI is also bringing new possibilities. These possibilities continue to create new models and opportunities for businesses that tap into them. Quantum and neuromorphic computing is the way forward.
This blog takes a deeper look into quantum and neuromorphic computing and explores which companies can benefit from these technologies.
A Look at The Future Of AI
The possibilities Artificial Intelligence can create are seemingly endless. Innovations are constantly taking place in the AI world. Given that, many business and information technology leaders are looking to better understand how it will affect their business now and in the future.
Taking a look at the future scenarios for how AI could evolve can help IT leaders demystify this emerging technology. Two such technologies are called neuromorphic or quantum computing. They offer us a new way forward by fulfilling our AI-related dreams. The quantum computing market alone is expected to reach $2.2 billion by 2026, so it’s definitely worth looking into.
The future of AI also depends on improving the capacity of intelligent systems by using powerful hardware. Hardware such as neuromorphic computing and quantum computing will allow companies to build AI solutions that are extremely fast and can encapsulate more data and knowledge.
For example, a virtual assistant may now have the computing capacity to handle one or two products. But with more powerful hardware, it could cover more products. Advantages in this area are ongoing.
Let’s examine these in detail. Read more:Answering The Top Burning Questions On AI Implementation For Businesses!
A Deeper Look into Quantum and Neuromorphic Computing
Neuromorphic computation and quantum computing always seemed that they were years away. The fact is commercial neuromorphic chips and quantum computers are in use today. These two new technologies are going to change what looked like a straight path to Artificial Intelligence.
1. Neuromorphic computation
Neuromorphic computation attempts to imitate the way a human brain works. In simple terms, hardware and software elements of a computer are wired to mimic the human nervous system and cerebral system.
The goal of neuromorphic computation is to create devices that can learn, retain information, and make logical deductions just like a human brain does. It also attempts to imitate the human brain by searching for new information.
However, unlike quantum computing neuromorphic computing does is not that demanding. Where quantum computers need temperatures close to absolute zero, neuromorphic computers can easily work in normal conditions.
This increases its practicality and potential to integrate this technology in all kinds of devices.
2. Quantum computing
Quantum computing deals with the world of atoms and subatomic particles inside those atoms. Unlike neuromorphic computation, quantum computing works on the principle of quantum entanglement.
So, the smaller the computer gets, the more powerful they seem to become. Quantum computing provided powerful new possibilities.
Though it is more complex than traditional computing, quantum computing opens the door to potentially solving very large and complex computational problems. It can potentially deliver a big computational upgrade for ML and AI computing.
Quantum computers will not replace traditional computers. Instead, they will require the support of traditional computers for their specialized abilities. Read more: Driving Business Innovation and Success Through Sustainability
Industries That Can Leverage Quantum Computing and Neuromorphic Computation
1. Industries That Can Leverage Neuromorphic Computation
a) Aerospace and defense: Neuromorphic computing architecture can help in pattern recognition, event reasoning, and robust decision-making. It can also aid in adaptive learning and autonomous tasking for energy-efficient agile Air Force platforms. b) Self-driving cars: Similar to space communications, neuromorphic computing enhances self-driving. In imitation of the human brain, neuromorphic chips attempt to think and learn on their own and then adapt their learning to unexpected scenarios on the road.
While conventional computers run commands sequentially, neuromorphic computers process and store data almost at the same time. This makes self-driving cars more energy efficient. It can also help autonomous vehicles learn skills and execute tasks more efficiently. c) Healthcare: Neuromorphic platforms can be used for the hardware-based implementation of ML methods in treating Chronic Obstructive Pulmonary Disease (COPD) in home-care environments. Real-time analysis of data can be obtained by bringing data from the backend onto a neuromorphic chip.
Furthermore, securing sensitive medical data on a single chip complies better with patient privacy regulations. Since neuromorphic platforms process data near a patient, it offers a large fault tolerance for medical applications.
Moreover, hardware-based neuromorphic systems require less computational power making them perfect for PoC medical devices.
2. Industries That Can Leverage Quantum Computing
a) Aerospace: By considering an exponential number of variables, quantum computing could help determine the optimal alternative for each route. It can also help find the best way to allocate resources so that the crew and passengers are impacted as little as possible. b) Healthcare and Pharmaceuticals: Harnessing the power of quantum computing can significantly accelerate the timelines of various stages of the pharmaceutical research and development process. It can help life science companies by accelerating the speed of the pre-clinical phase and reducing the cost of drug development. c) Finance: Quantum computing will be able to help solve the problems of customers in finance institutes. It can optimize investment portfolios and financial derivatives. It can also enable the institutions to accurately characterize anomalous transactions and rapidly detect fraud. d) Chemistry: It is likely that quantum computing can be applied to simulate the properties and behavior of new molecular structures in chemistry. It can address the probabilistic challenges of quantum mechanics. In the future, quantum computing is expected to predict molecular properties for new molecules. Read more:Data and AI: How It Has Transformed Over The Years And Trends To Watch out For!
Conclusion
In the coming years, advances in Artificial Intelligence will reach the superintelligence stage. However, the transition to new technology has already begun.
Many companies are incorporating this unique fixture as it has helped them achieve better sales and forecasts. It has also provided them with growth opportunities. Fingent top custom software development company is confident that you would also benefit from implementing this in your business. Give us a call and let’s discuss what is best for your business.
Stay up to date on what's new
About the Author
Vinod Saratchandran
Vinod has conceptualized and delivered niche mobility products that cater to various domains including logistics, media & non-profits. He leads, mentors & coaches a team of Project Coordinators & Analysts at Fingent.
Businesses are always on the lookout for ways to optimize processes and gain greater visualization. When processes work efficiently, the output of the product is higher. This leads to workflows that run smoothly with minimum errors and higher capacity. A good reason for the growing popularity of process automation and visualization.
Automation and visualization are the future of the business strategy. Gone are the days of carefully filling in graph paper by hand. Today, process automation and visualization help enterprises up their game by allowing access to real-time models capable of accurately capturing the nuanced data sets.
In this blog, we will expand on how enterprises can up their game with process automation and visualization.
How Enterprises Can Up Their Game with Process Automation and Visualization
Data visualization enables human operators to manage vast sets of data, glean insights from different information sources, and perform operations more intuitively and strategically.
In the current data-immersed world, data visualization can significantly add value by conveying large datasets visually. What does this mean for your business? This means a better grasp of critical customer data.
According to the IDC, the collective sum of the world’s data is predicted to grow to 175 zettabytes by 2025. Processing such large amounts of data can become a problem.
By allowing automation and the right programs to sort out your business data, you can generate graphs. You will be able to use these graphs to up your game in business competition.
Data visualization offers businesses the hope of getting a grasp on data. Fortunately, the human brain can process and recognize trends, identify potential issues, and forecast future development from clear visual displays. Read more:How Powerful Is Data Visualization With Tableau
Look Out for Upcoming Powerful Trends in Automation and Visualization
1. AI and ML
Artificial Intelligence and Machine Learning render visualization more accurate and efficient. These technologies enable businesses to handle customer feedback without bias. Process automation allows you to sort the feedback in real-time and according to your specifications.
2. Unlock Big Data with Data Democratization
Large amounts of data are hard to understand. It requires data scientists and other experts to unlock its treasures. Not anymore. Advanced no-code data analysis platforms can automate your data process. This is called the democratization of data.
Democratization of data leaves it malleable and easy to display allowing your employees any level of tech support. When this is paired with the data visualization type, it can unlock big data results for teams at all levels of your organization.
3. Video Visualization Is Here to Stay
Young and old alike tend to retain the information they see over what they hear. This would mean that video infographics will be the future.
Video applications for business strategy and customer retention are key areas for future strategic data visualization implementation.
4. Real-time Visualization for Early detection
Knowing a problem at the exact moment it arises can assist businesses in customer retention and brand presence. Early detection can have a dramatic impact on the bottom line.
Process automation can help run a dashboard that allows users to submit their error reports to your customer support. Then the reviews can be tagged and analyzed using sentiment analysis.
5. Mobile Optimized Visualization
An increased number of people access the internet on their mobile devices. Your business needs mobile-optimized data visualization to stop customer churn.
It enables you to know if your potential customers are learning about your services through social media or an online review board. Though mobile-optimized visualization is an easy step, it is critical to keep your business on top of the game. Read more:7 Awesome Data Visualization Tools
Business Applications of Process Automation and Data Visualization
1. Financial Service and Insurance
The finance service industry is a prime candidate for process automation and data visualization. Two top requirements of this industry are customer response time and compliance with strict regulations.
When automated, quick decisions can be made based on pre-defined rules like loan applications, claims processes. businesses can use data visualization to make reliable predictions or risk calculations in the financial industry.
Insurance fraud can cost billions of dollars damage. Process automation and data visualization can improve fraud detection. Read more: Deploying RPA for Finance, Healthcare, and IT Operations.
2. Distribution and Logistics
Process automation and data visualization can minimize costs by planning transport promptly, reducing costs of downtimes and maintenance.
3. Sales
Data visualization can greatly improve relationships with your customers. It helps you know the needs of your customers better, and address each of them directly in real-time.
4. Marketing
Data visualization and process automation can reduce marketing costs substantially. These technologies can help evaluate the demographics, location, transactions, and interests of your customers. Visualizing these details can help you understand their purchase patterns.
Thus, data visualization can be used to create and target new customer segments. Cross-selling is another advantage. At the same time, data visualization may reveal that customers are dissatisfied. Identifying this and responding quickly can counteract the situation to retain your customer base.
5. Healthcare
Process automation and data visualization enable cheaper healthcare. It can help predict disease occurrence and proactively propose countermeasures.
6. Science and research
Visualization enables the evaluation of the data of an experiment. Process automation and visualization can be advantageous especially when an experiment generates large amounts of data within seconds.
7. Production
Large amounts of data are generated during production. Using process automation and visualization can help plan preventive maintenance and prevent production delays or downtimes.
Prepare Your Business For The Future With Fingent
Fingent helps enterprises automate document-based processes. We can help you create safer sharing and collaboration. Our platform allows you to create teams, assign roles and privileges, and streamline communication.
Fingent’s partner integrations allow you to use it together with your existing software. Our top-level measures protect our users’ data. The encryption we provide ensures content integrity and prevents alteration.
Fingent top custom software development company can help your organization reach the goal of paperwork elimination. Doing so can lead to efficient resource distribution throughout the organization.
What’s more, it reduces carbon footprint. Our experts bring along specializations supported by scientific rigor and in-depth knowledge of advanced techniques to design, develop, and deploy solutions for process automation and visualization. Give us a call today and let’s get talking.
Stay up to date on what's new
About the Author
Vinod Saratchandran
Vinod has conceptualized and delivered niche mobility products that cater to various domains including logistics, media & non-profits. He leads, mentors & coaches a team of Project Coordinators & Analysts at Fingent.
Over 95% of businesses struggle to manage unstructured data in their day-to-day operations. Inability to decipher data prevents them from navigating the market successfully, making business forecasts, and customizing their offerings to match the changing market trends. This proves why data analytics is crucial in enterprise strategy planning. By 2030, the global big data and analytics market value is expected to touch $684.12 billion. As more companies embrace data analytics to enhance customer experience, optimize existing business processes, and lower costs, it’s important to take note of the data and analytics trends that will hold the reins in 2024 and beyond. Here’re ten trends to behold:
1. Scalable and Responsible AI
Research and Markets report that AI makes analytics 48% more effective for industry applications. Traditionally, artificial intelligence (AI) techniques were applied to analyze historical data. However, unpredicted events such as the COVID-19 pandemic increase the demand for real-time data analysis. Adaptive machine learning promotes scalable, responsible, and intelligent AI that offers insightful business analytics even with smaller datasets. Scalable AI will enhance learning algorithms, reduce time-to-value, and make business systems and data more interpretable. AI integration will increase the precision of data analysis in 2024. Read more:6 Ways Artificial Intelligence is Driving Decision Making
2. Hybrid, Multi-cloud, and Edge Computing
According to McKinsey, 70% of companies will adopt hybrid or multi-cloud technologies and processes by 2022. Hailed as the hallmarks of distributed IT infrastructures, multi-cloud management and edge computing enable companies to extend their computing capacity to the edge of their networks. This allows businesses to reach more data-hungry devices as the data is analyzed locally, close to the data source. Edge and multi-cloud reduce latency and improve decision-making with advanced, on-demand analytics. Today, every business generates volumes of unstructured data. Relying on traditional batch-based reporting to analyze big data cannot help anymore. 2024 will see the rise of distributed cloud models powered by hybrid, multi-cloud, and edge environments. Read more:Future-proof Your Business with 5G, Edge Computing, and Cloud
3. Data Fabric Architecture
Data fabric architecture supports businesses to seamlessly navigate the complex digital business landscape that generates a lot of unstructured data every minute. It allows organizations to adopt a modular approach, known as composability, through which organizations can integrate new capabilities or features as low-code, reusable, individual components. Unlike the traditional monolithic architecture, composability allows businesses to integrate new features and changes to their enterprise applications without redoing their tech stacks. According to Gartner, data fabric reduces the deployment time by 30% and maintenance time by 70%. The ability to reuse technologies and capabilities from numerous data hubs, data lakes and data warehouses is expected to go a long way in tailoring analytics experiences.
4. Data Democratization and Self-service Analytics
The rise of low-code/ no-code digital platforms is accelerating the shift to self-service analytics. These platforms empower non-technical business users to access data, garner insights and make faster decisions. Today, self-service analytics is improving business response, enterprise agility, speed-to-market, and decision-making. InfinCE, a low-code workplace orchestration platform enables seamless team collaboration by extending your ability to integrate multiple business apps. Its data-powered business dashboard software supports marketers and non-technical users to analyze data, glean insights, track KPIs, and make strategic decisions. As data becomes the key to unlocking business value, 2024 will see the democratization of data extending beyond the realms of technical analysts and data scientists to ensure better inclusivity.
5. XOps
The merger of development (Dev) and IT operations (Ops) has given rise to the “Ops trend.” The list of acronyms with the suffix Ops is expanding pretty fast. XOps aims to bring all these terms (DevOps, DataOps, MLOps, ModelOps, etc.) under one umbrella to advance automation and AI adoption, and minimize the duplication of technologies and processes. XOps enables data and analytics deployments to function effectively in tandem with other software fields. In 2024, more data analytics experts will start using XOps to operationalize and automate their processes in conjunction with the software development cycle. This eliminates data management and insights generation challenges from the very beginning of software development. XOps will augment the power of enterprise technology stacks to deliver high-quality on-demand analytics. Read more:DevOps: Building a New Culture of Software Development and Delivery
6. Graph Analytics
Gartner estimates that by 2025, 80% of data and analytics innovations will be crafted using graph technologies. Graph analytics employs deep learning algorithms to correlate multiple data points (entities such as people, events, things, locations, etc.) scattered across various data assets by exploring their relationships. This offers businesses a holistic understanding of the market, customer segments, consumer preferences and behavior, logistics, and risks. Graph analytics improves contextual understanding which enables businesses to identify problems and address them faster. SAP HANA is a leading graph database that comes with built-in processing engines to perform context-based data search. It allows users to access the correct data quickly. In 2024, graph technology will be used widely in search engine optimization, fraud and identity detection, supply chain logistics, social network analysis, and so on. Read more:SAP HANA Helps Unlock Massive Health Data
7. Small and Wide Data
Until 2020, historical data replicating past conditions was enough to train AI and ML models. Disruptions caused by the COVID-19 outbreak have made such past data obsolete. It means that data analytics professionals should find new ways to use the available data more effectively. “Small data” and “wide data” techniques reduce the volume of data required for training AI models and help extract more value from diverse and unstructured data sources. By 2025, 70% of organizations will switch from big to small and wide data, improving contextual analytics and making AI systems less data-hungry.
8. Decision Intelligence
Decision Intelligence (DI) is a data analytics discipline that analyzes the sequence of cause and effect to create decision models. These decision models visually represent how actions lead to outcomes by observing, investigating, modeling, contextualizing, and executing data. DI helps make faster and more accurate decisions that result in better outcomes. Gartner forecasts that in the next two years, one-third of large corporations will leverage DI to augment their decision-making skills.
9. Generative AI
Generative AI is an artificial intelligence technique that uses existing text, images, and audio files to generate new content. This technique proves to be highly useful in producing new and authentic data that mimics the original in data-scarce situations. Generative Adversarial Networks (GANs) and Variational Autoencoders (VAEs) are the two key technologies that support Generative AI. By 2025, generative AI will account for 10% of all data produced, up from less than 1% today, states Gartner. In 2024, Generative AI is expected to augment targeted marketing, drug development, and software code creation.
10. Natural Language Processing
If you’re using Google Assistant or Amazon Alexa, you’ve already experienced NLP in action. NLP supports data analytics in multiple ways by leveraging techniques such as speech recognition, machine translation, chatbots, text classification, sentiment analysis, and so on. It offers business leaders, marketers, salespeople, and researchers with the precise insights needed to make better decisions. Reports show that the rising demand for advanced text analytics is driving NLP adoption in sectors like healthcare, social media analytics, and consumer and market intelligence. 2024 will witness the rise of no-code and low-code NLP platforms that will make AI and ML more ubiquitous.
A Chief Data Officer (CDO) survey held by Gartner in 2021 found that 72% of data and analytics leaders are involved in their organization’s digital transformation initiatives. More organizations are now realizing the tie between building a data-driven business and steering digital transformation. Start your data-driven journey with customized data analytics solutions built by Fingent. Leverage our top data analytics and visualization techniques to boost your business and customer intelligence, optimize strategies, and enhance productivity. Contact us to know more!
Stay up to date on what's new
About the Author
Vinod Saratchandran
Vinod has conceptualized and delivered niche mobility products that cater to various domains including logistics, media & non-profits. He leads, mentors & coaches a team of Project Coordinators & Analysts at Fingent.
Undoubtedly, data is what we see almost everywhere, and it is enormous. And it doesn’t stop there, it is growing continuously at a level beyond imagination! Let’s have a look at how it has changed over the years.
A look into how Data and AI transformed in years!
In the 1950s, when there were fewer technological developments, companies would collect the data(offline) and analyze it manually. This was also backed by limited data sources that made it time-consuming in obtaining the results.
The mid-2000s paved the way for changing the world for the better and it was during this time the term “big data” was coined. Almost every business that had something to do with digital infrastructure started looking for ways to use the large data and come up with meaningful insights.
This era also saw the invention of tools like Data mining, OLAP, etc., taking technological advancements to the next level. In general, the internet gained immense popularity not only for organizations but also for households. During this time, technology became more advanced and provided automated options for managing data, and data analysts could analyze data, trends, etc., and provide better recommendations.
Google, Amazon, Paypal, and others also made a mark causing the volume of data to reach newer heights. However, all this posed a storage and processing problem.
The late 2000s to early 2010s saw a surge in Facebook, Twitter, Smartphones, and connected devices. The companies used improved search algorithms, recommendations, and suggestions driven by the analytics rooted in the data to attract their customers. Enterprises also realized that would have to deal with unstructured data and so they got familiar with databases such as NoSQL. New Technologies were introduced for faster data processing and machine learning models were used for advanced analytics.
Now, businesses are a step ahead and using automated tools using cloud and big data technologies. With cloud platforms, it is now easier to enable massive streaming and complex analytics.
Having seen how data has evolved over the years, let’s have a look at how Artificial Intelligence has transformed in the last generation.
In 1950, a British mathematician and WWII code-breaker- Alan Turing was one of the first people to come up with the idea of machines that could think. To date, the Turing Test is used as a benchmark to determine a machine’s ability to think like a human. While this notion was ridiculed at the time, the term artificial intelligence gained popularity in the mid-1950s, after Turing’s death.
Later, Marvin Minsky, an American cognitive scientist picked up the AI torch and co-founded the Massachusetts Institute of Technology’s AI laboratory in 1959. He was one of the leading thinkers in the AI field through the 1960s and 1970s. It was the rise of personal computers in the 1980s that sparked interest in machines that think.
That said, it took several decades for people to recognize the true power of AI. Today, Investors and physicists like Elon Musk and Stephen Hawking are continuing the conversation about the potential for AI technology in combination with big data could have and how it could change human history.
AI technology’s promising feature is its ability to continually learn from the data it collects. The more the data it collects and analyses through specially designed algorithms, the better the machine becomes at making predictions.
Impact on business
AI and big data have an impact on businesses like never before. Whether it is workflow management tools, trend predictions, or even advertising, AI has changed the way we do business. Recently, a Japanese venture capital firm became the first company ever to nominate an AI board member for its ability to predict market trends faster than humans.
On the other hand, data has been the primary driver for AI advancements. Machine learning technologies can collect and organize a large amount of data to make predictions and insights that otherwise cannot be achieved with manual processing. This not only increases organizational efficiency but reduces the chances of any critical mistake. AI can detect spam filtering or payment fraud and alert you in real-time about malicious activities.
AI machines can be trained to handle incoming customer support calls thereby reducing costs. Additionally, you can use these machines to optimize the sales funnel by scanning the database and searching the Web for prospects that have similar buying patterns as your current customers.
5 trends in data and artificial intelligence that can help data leaders.
1. Customer experience will be the key
Supply chain and operating costs will mean nothing if you are unable to hold on to your customers. Today, businesses have to be more connected with their customers to be on top of the game. From in-person and digital sales to call centers, companies will have to collect data to have a holistic view of the customer. Businesses must consider other forms of interaction such as using voice analytics to understand how customers interact with call centers or chatbots.
2. Leveraging External data
External data can provide early warning signs about what’s going on. To make external data work, companies must start with a business problem and then think about the possible data that could be used to solve it. That said, companies might need to modernize data flows to leverage external data.
While many businesses have started leveraging external data, some companies haven’t leveraged it yet as they are either too focused on internal data or finding it difficult to transfer data.
A prime example of brands that used external data is Hershey’s Chocolates. It leveraged external data to predict an increase in the number of people using chocolate bars for Backyard S’mores and a decline in sales for smaller candy bars for trick-or-treating.
3. CDOs leading the way towards a data-driven culture
Introducing any new technology without training your employees to adapt and figure out new skills and processes will not be effective. According to Cindi Howson, chief data strategy officer at analytics platform provider ThoughtSpot, Chief Data Officers (CDOs) need to take the lead and empower their employees and the organization to gain time and efficiency with data. Also, CDOs will have to make sure to upskill employees to take full advantage of new technology.
4. Multi-Modal learning
With advances in technology, AI can support multiple modalities such as text, vision, speech, and IoT sensor data. All this is helping developers find innovative ways to combine modalities to improve common tasks such as document understanding.
For example, the data collected and processed by healthcare systems can include visual lab results, genetic sequencing reports, clinical trial forms, and other scanned documents. This presentation, if done right, can help doctors identify what they are looking at. AI algorithms that leverage multi-modal techniques (machine vision and optical character recognition) could augment the presentation of results and help improve medical diagnosis.
5. AI-enabled employee experience
Business leaders are starting to address concerns about the ability of AI to dehumanize jobs. This is driving interest in using AI to improve the employee experience.
AI could be useful in departments such as sales and customer care teams that are struggling to hire people. Along with robotic process automation, AI could help automate mundane tasks to free up the sales team for having a better conversation with customers. Additionally, it could be used to enhance employee training.
Leveraging data and Artificial intelligence has grown due to the pandemic and businesses are digitally connected than before the lockdown.
At Fingent, we equip business leaders with insights, advice, and tools to achieve their business goals and build a future-proof organization. To learn more about how we fuel decision-makers to build successful organizations of tomorrow, contact us.
Stay up to date on what's new
About the Author
Vinod Saratchandran
Vinod has conceptualized and delivered niche mobility products that cater to various domains including logistics, media & non-profits. He leads, mentors & coaches a team of Project Coordinators & Analysts at Fingent.
Exploratory Data Analysis (EDA) is a statistical approach used to analyze data and produce descriptive and graphical summaries. Analysts may or may not use a statistical model, but EDA primarily foresees what the data can reveal to us beyond formal modeling.
With EDA you can analyze your data as it is, without the need to make any assumptions. EDA further validates and expands the practice of using graphical methods to explore data. EDA gains insights from statistical theories that give easily decipherable insights. Exploratory data analysis techniques can also be used to derive clues from data sets that are unsuitable for formal statistical analysis.
Exploratory Data Analysis displays data in such a way that puts your pattern recognizing capabilities to full use. The patterns are evident to an examination that is careful, direct, and most importantly assumption-free. Thus, you can understand relationships among variables, identify problems such as data entry errors, detect the basic data structure, test assumptions, and gain new insights.
Purpose of Exploratory Data Analysis
The prime purpose of EDA is to study a dataset without making any assumptions. This helps the data analyst to authenticate any assumptions made in devising the problem or operating a particular algorithm. Researchers and analysts can, therefore, recommend new schemes that were not previously considered.
In other words, you apply inductive reasoning to obtain results. These results may be in opposition to the theories that directed the initial data collection process. Thus, EDA becomes the driver of transformation. This approach allows you to oppose planned analyses and probe assumptions. The ensuing formal analysis can continue with better credibility. EDA techniques have the potential to uncover further information that may open new areas for research.
Role of EDA in Data Science
We need to understand the role of EDA in the whole process of data science. Once you have all the data, it has to be processed and cleaned before performing EDA. However, after EDA, we may have to repeat the processing and cleaning of data. The cleaned data and results obtained from this iteration are further used for reporting. Thus, using EDA, data scientists can rest assured that the future results would be logical, rightly explained, and relevant to the expected business circumstances.
EDA helps to clean the feature variables that are to be used for machine learning. Once data scientists get familiarized with the data sets, they may have to go back to feature engineering since the early features may be unable to serve the objective anymore. After completion of the EDA, data scientists obtain a feature set that is required for machine learning. Each dataset is generally explored using multiple techniques.
Exploratory data analysis is carried out using methods like:
Univariate Visualization – This is a simple type of analysis where the data analyzed consists of a single variable. Univariate analysis is mainly used to report the data and trace patterns.
Bivariate visualization – This type of analysis is used to determine the relationships between two variables and the significance of these relationships.
Multivariate visualization – When the data sets are more complex, multivariate analysis is used to trace relationships between different fields. It reduces Type I errors. It is, however, unsuitable for small data sets.
Dimensionality Reduction – This analysis helps to deduce which parameters contribute to the maximum variation in results and enables fast processing by reducing the volume of data.
Using these methods, a data scientist can grasp the problem at hand and select appropriate models to corroborate the generated data. After studying the distribution of the data, you can check if there’s and missing data and find ways to cope with it.
Then comes the outliers. What are your outliers and how are they affecting your model?
It’s always better to take small steps at a time. So you need to check if you can remove some features and still get the same results. More often than not, companies just venturing into the world of data science and machine learning find that they have a lot of data. But they have no clue how to use that data to generate business value. EDA techniques empower you to ask the right questions. Only specific and defined questions can lead you to the right answers.
Suppose you have to find the sales trend for an online retailer.
Your data set consists of features like customer ID, invoice number, stock code, description, quantity, unit price, country, and so on. Before starting, you can do your data preprocessing, that is, checking the outliers, missing values, etc.
At this point, you can add new features. Suppose you want the total amount. You multiply quantity and unit price to get this feature. Depending on the business requirement, you can choose which features to add. Moving on, by grouping the countries and quantity or total amount together, you can find out which countries have maximum and minimum sales. Using Matplotlib, seaborn, or pandas data frame you can visually display this data. Next, by grouping the year and total amount, you can find out the sales trend for the given number of years. You can also do the same for each month and find you out which time of the year has shown a spike or drop in sales. Using this same method, you can identify further problems and find out ways to fix them.
The key to exploratory data analysis is to first understand the LOB and get a good hang of the data to get the desired answers. Get in touch with us to know more about EDA.
Stay up to date on what's new
About the Author
Bhuvana O G
Bhuvana is a Senior Content Specialist at Fingent. She loves to research and develop creative and unique content related to technology and marketing. When not involved in full-time writing, you can see her pitching into editing and proof-reading all sorts of marketing collateral crucial for the company's branding.
Nurturing communities and building loyalties is now more critical than ever for all retail brands. With instant access to the latest trends and technologies, customers demand better experiences in their interactions with retail brands across all touchpoints. Hence, Customer experience (CX) has become the most important facet of the retail marketing strategy. Retailers, therefore, have to focus on improving CX through every channel.
Importance of CX solutions
Companies can leverage authentic data and modern technology to transform customer experiences and positively impact their business’ future. While most organizations do have systems in place to track the performances of their CX strategies, few track the end-to-end customer journey. Using appropriate CX solutions, organizations can bridge the gap between expected and actual experiences. CX solutions help companies measure and understand the impact of their CX management strategies.
By employing CX solutions, you can manage the interactions that current and potential customers can have with your brand, thus enabling you to meet or exceed their expectations. CX solutions leverage customer interactions to align the brand image according to the customer’s perceptions. This helps you foster strong and long term customer relationships.
Staying abreast of the latest technologies and trends in Customer Experience will help you stay ahead of the competition. It’s time to hone your CX strategies by following these latest trends that rule the CX market.
Omni-channel CX: Customer journeys have become more dynamic than ever. Based on convenience, customers constantly switch mediums. Since the line between physical and digital channels are blurring, customers expect seamless experiences in their interactions across all channels. It’s important for retailers to strike a proper balance between the “traditional” and “online” business models based on their customers’ preferences. Adopting omnichannel customer care strategies will help resolve complex issues quickly.
Artificial Intelligence: CX enhancement requires comprehending vast amounts of chaotic and complex data in real-time at high speeds. This scenario is most suitable for AI-powered solutions. Using AI, you can replicate human-like engagements (chatbots for example), track customer-behavior and roll out customized campaigns on their preferred channel of operation. Thus you turn your data into valuable customer insights.
Hyper personalization: Customers expect high levels of personalization and prefer to buy from brands that offer services/products that are fine-tuned according to their requirements. With a hyper-personalized approach, retailers can identify subtle customer traits and deliver highly targeted and relevant services. To develop this level of hyper-personalization, your data and analytics have to be aligned to paint a clear picture of your customers’ choices.
AR/VR: Augmented Reality (AR) and Virtual Reality (VR) technologies are touted as the “technologies of the future” since they provide highly immersive and engaging customer experiences. AR and VR provide customers with a hands-on experience which helps them make better choices. Many retailers are already reaping the benefits of implementing these futuristic technologies. For instance, Ikea allows customers to check how the furniture would look in their homes before buying using AR. Famous clothing brand Marks and Spencer uses virtual try-on mirrors to boost their store experiences.
Virtual assistants and chatbots:Virtual assistants and chatbots enable companies to deliver faster and more efficient services at low costs. Some may argue that chatbots lack empathy and hence cannot replace human customer service representatives. However, you should not overlook the fact that advances in AI have given bots the ability to decipher human emotions. By combining the technologies of a virtual assistant and chatbots, you can provide your customers with personalized and empathetic experiences.
Customer Experience will continue to be crucial for brands to survive in a disruptive business environment. Retailers need to adopt agile models to retain customers and attract new ones. Going forward, CX will also depend on employee experiences. If your employees are empowered, they will in turn care for your customers. Your interactions, both with your customers as well as your employees across all channels need to be more meaningful and effective.
Gartner states that 64% of consumers give more importance to their experiences with a brand than to the price of a product or service. Fingent helps you implement the latest technological advancements to make your CX strategies fruitful. Contact us to know more.
Stay up to date on what's new
About the Author
Tony Joseph
Tony believes in building technology around processes, rather than building processes around technology. He specializes in custom software development, especially in analyzing processes, refining it and then building technology around it.He works with clients on a daily basis to understand and analyze their operational structure, discover (and not invent) key improvement areas and come up with technology solutions to deliver an efficient process.
Can Data Warehousing Enhance the Value of Data Visualization & Reporting?
Organizations rely heavily on data to make crucial business decisions. Hence, it is important for your business to have access to relevant data. That is where a well-designed data warehousing comes to your rescue!
Besides gaining actionable insights, corporate executives, business managers, and other end-users make more informed business decisions based on historical data.
Business Intelligence is a process that includes the tools and technologies to convert data from operational systems into a meaningful and useful format. This helps organizations analyze and develop meaningful insights to take timely business decisions. The information derived from these tools demonstrate the root cause of your business problems and allow decision-makers to strategize their plans based on the analysis.
Business Intelligence is information not just derived from a single place, but multiple locations and sources. It can be a combination of the external data derived from the market and the financial and operational data of an organization that is meaningfully applied to create the “intelligence”.
Data Warehouse
Data warehouse is a repository that collects data from various data sources of an organization and arranges it into a structured format. An ideal data warehouse set up will extract, organize, and aggregate data for efficient comparison and analysis. Data warehouse supports organizations in reporting and data analysis by analyzing their current and historical data. This makes it a core component of Business Intelligence.
Unlike a database, that stores data within, at a fully normalized or third normal form (3NF), a data warehouse keeps the data in a denormalized form. It means that data is converted to 2NF from 3NF and hence, is called Big Data.
Key benefits of a Data Warehouse
Combine data from heterogeneous systems
Optimized for decision support applications
Storage of historical and current data
Why We Need Data Warehouse for Business Intelligence?
Before the business intelligence approach came into use, companies used to analyze their business operations using decision support applications connected to their Online Transaction Systems (OLTP). Queries or reports were retrieved directly from these systems.
However, this approach was not ideal due to:
Quality issues
Reports and queries were affecting business transaction performance
Data resides in heterogeneous sources
Non-availability of historical data
Non-availability of data in the exact form required for reporting
Connecting your organization’s business intelligence tools to a data warehouse can provide you benefits in terms of production, transportation, and sale of products.
Data Warehousing and Business Intelligence Using AWS
Today, traditional BI has given way to agile BI where agile software development accelerates business intelligence for faster results and more adaptability. Big Data is growing fast to provide useful insights for making improved business decisions.
There has been a paradigm shift in data storage with warehousing solutions moving increasingly to the cloud. Amazon Redshift, for instance, is one of the most popular cloud services from Amazon Web Services (AWS). Redshift is a fully-managed analytical data warehouse on cloud, that can handle petabyte-scale data, which enables analysts to process queries in seconds.
Redshift offers several advantages over traditional data warehouses. It provides high scalability using Amazon’s cloud infrastructure to set-up and for maintenance, without the need for upfront payments. You can either add nodes to a Redshift cluster or create additional Redshift clusters to support your scalability needs.
You can use AWS Marketplace ISV Solutions for Data Visualization, Reporting, and Analysis.
Data visualization helps you identify areas that need attention or improvement, clarify factors that influence business such as customer behavior, and making decisions such as finding out a suitable market for your product or predicting your sales volumes, and much more.
TIBCO Jaspersoft, for example, is a solution that delivers embedded BI, production reporting, and self-service reporting for your Amazon data at affordable rates. It features the ability to auto-detect and quickly connect to Amazon RDS and Amazon Redshift. Jaspersoft is available in the AWS Marketplace in both single-tenant and multi-tenant versions. TIBCO Jaspersoft for AWS includes the ability to launch in a high availability cluster (HA) as well as with Amazon RDS as a fault-tolerant repository. Pricing is based on the Amazon EC2 instance, type as well as the chosen single or multi-tenant mode.
Image source: http://bit.ly/2IWWCDn
Summary
By moving your analytics and business intelligence to a hybrid cloud architecture you will be able to handle huge amounts of data and scale at the rate of expansion required by your business. You will also be able to deliver information and solutions at the speed that your employees and customers demand, and gain insights that will enable your organization to innovate faster than ever.
Business Intelligence and Data Warehousing are two important aspects of the survival of any business. These technologies give accurate, comprehensive, integrated, and up-to-date information on the current enterprise scenario which allows you to take the required steps and make crucial decisions for your company’s growth. To know how your business can benefit from the latest technologies, get in touch with our custom software development experts today!
Stay up to date on what's new
About the Author
Sumitha S
Sumitha has 10+ years of experience working for various projects in public service and insurance domains using reporting and business intelligence tools as BI Developer. She works as Project coordinator and Analyst at Fingent and is enthusiastic to learn new technologies and process improvements that help customers improve their business systems.
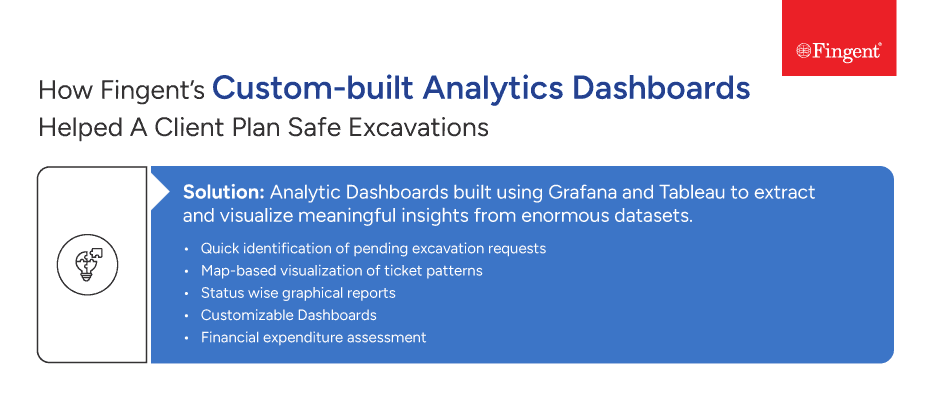


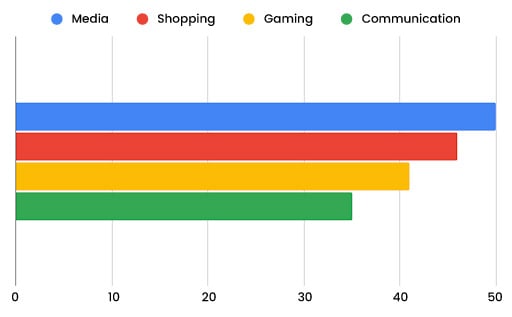
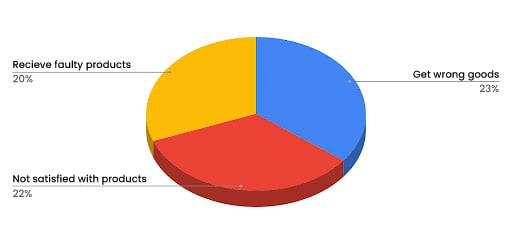
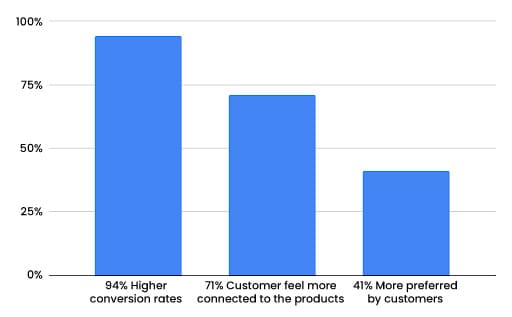


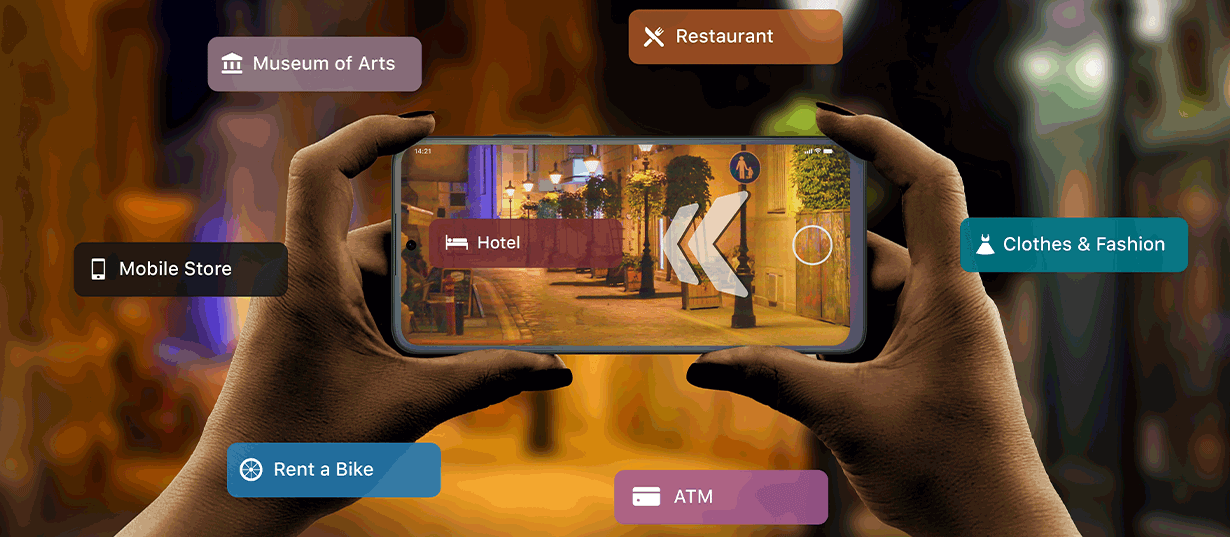
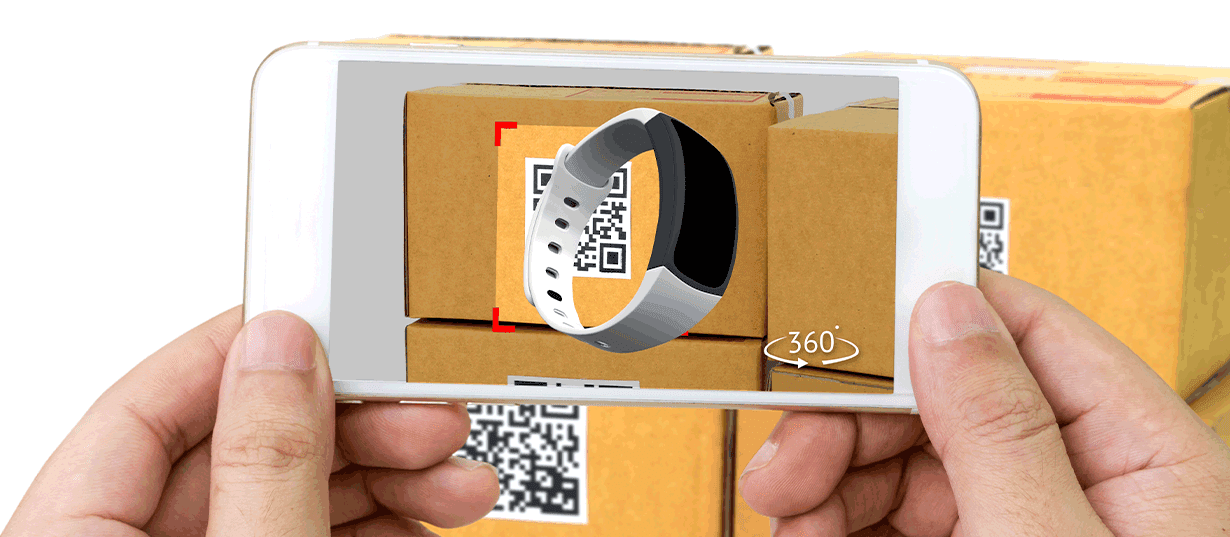

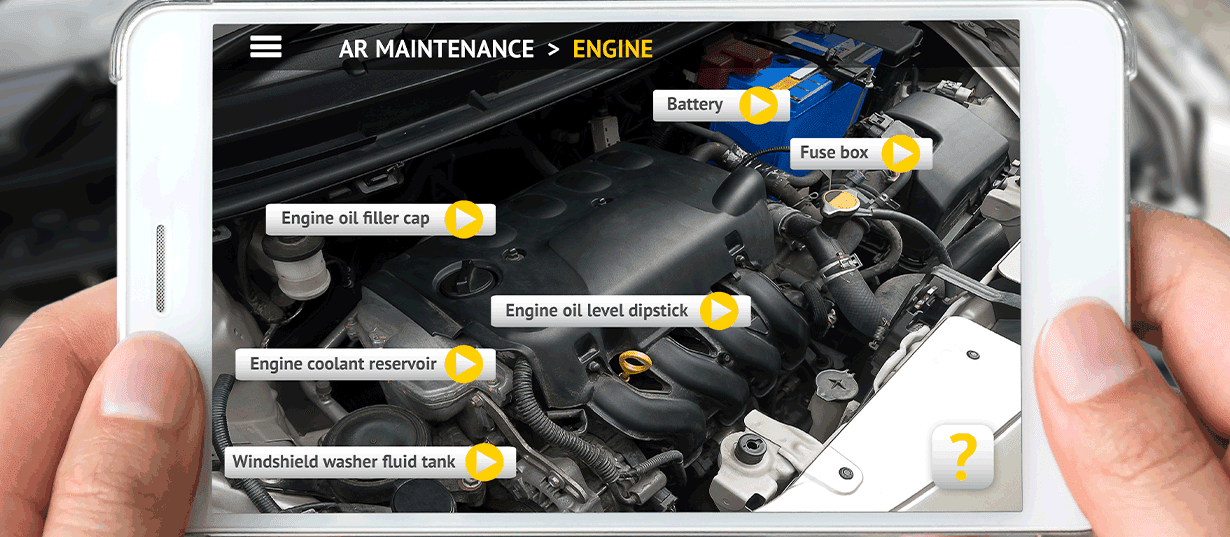

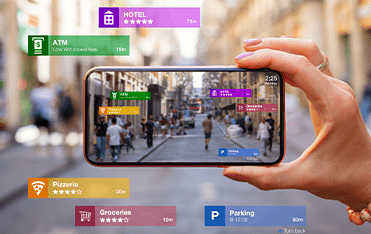


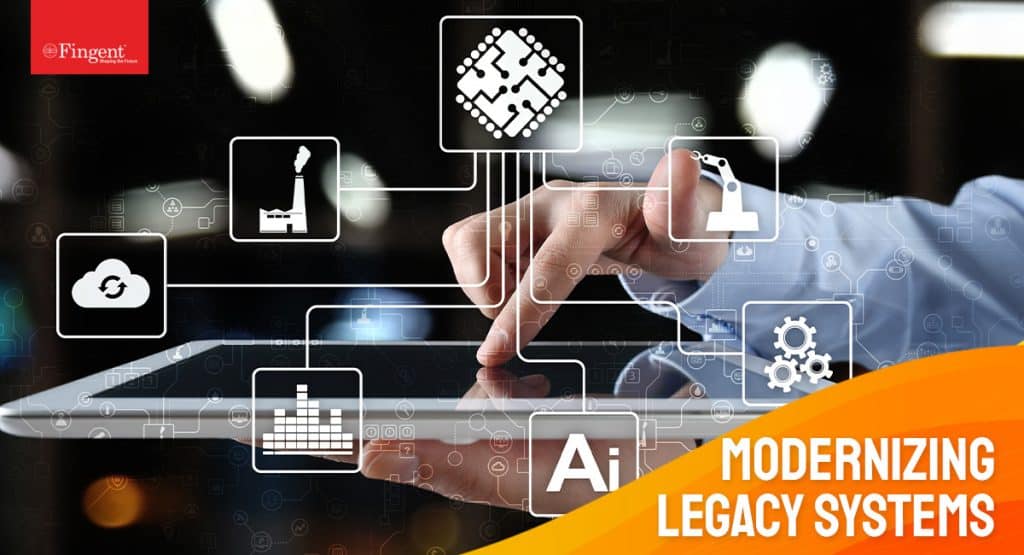

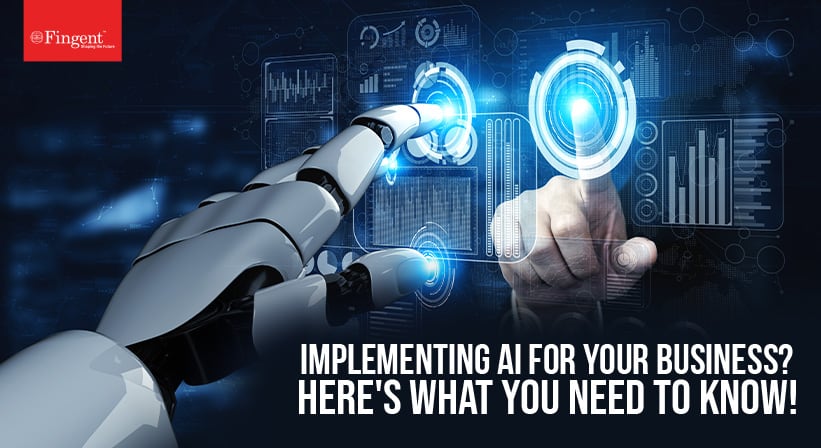

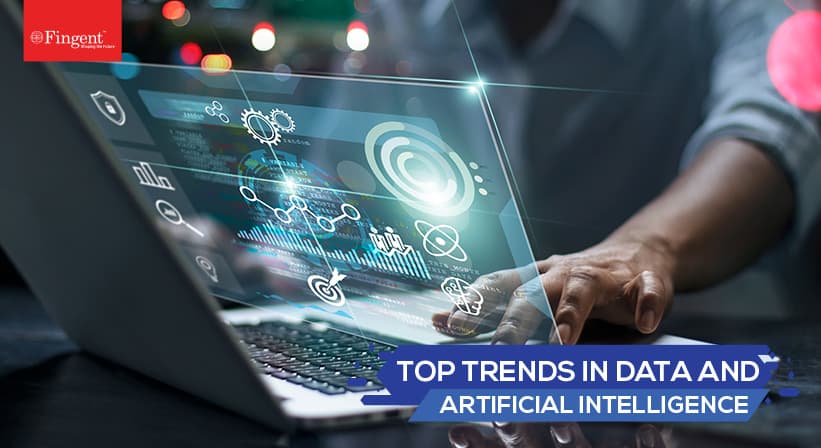

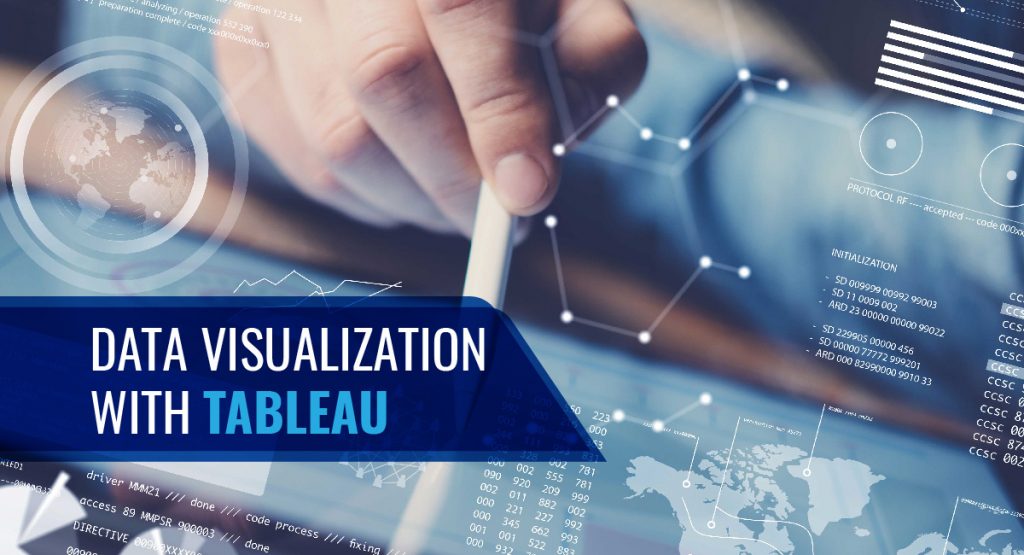


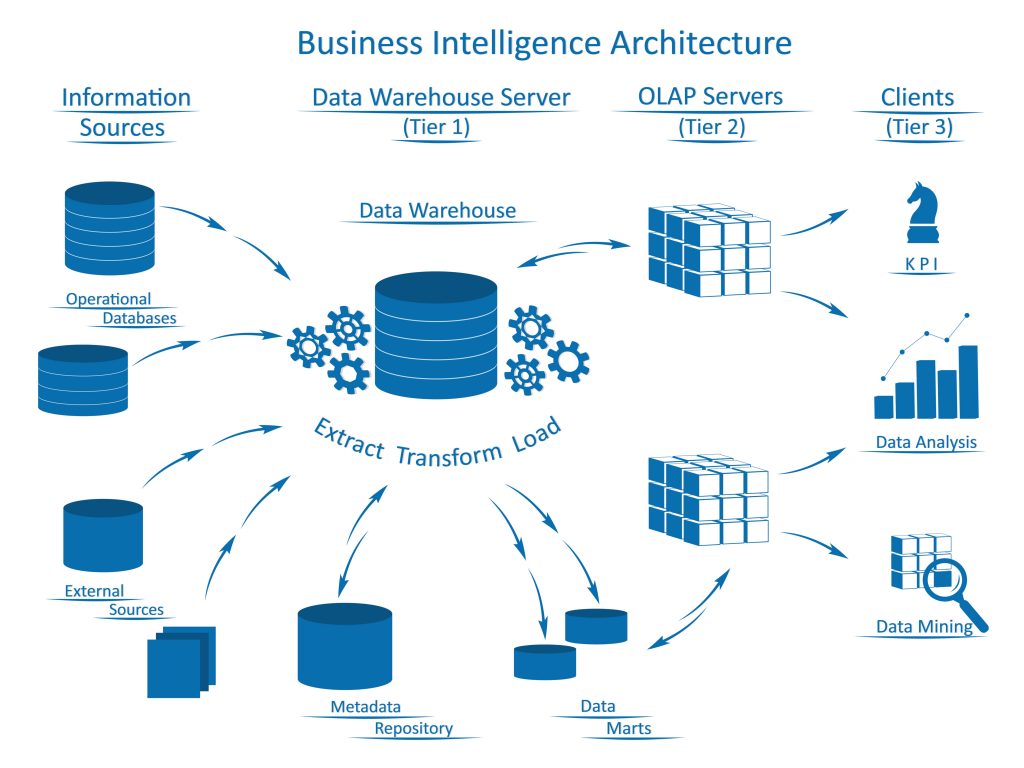
 Image source: http://bit.ly/2IWWCDn


