Tag: Business Intelligence
Business Intelligence in Financial Services is proving to be a game changer.
Business intelligence is a novel technology backed by AI. It is a combination of strategies and processes. Simply put, BI collects, cleans, formats, and analyzes data.
No big deal? Think again!
In a world that is ruled by data, this is a superpower.
Business intelligence is, in fact, a CFO’s best friend. It enables users to perform a wide range of activities with great ease. Since their advent, BI solutions have played a key role in banking and finance services. Business Intelligence in Financial Services offers priceless tools for risk assessment and cost management plans. They also provide detailed customer insights – a 360-degree view of the customer, which is priceless. So, in our current era, where data is everything, BI has become a valuable asset that offers support in decision-making.
Let’s discuss this in detail. First, let’s talk about the elusive 360.
Elevate Your Customer’s Digital Banking Experiences
The Need for a 360-View of Customers and Buyers in the Store
This technology is growing in popularity. It has become a well-favored tool among companies worldwide. A recent report predicts growth in the global business market. The predicted price for business intelligence and analytics software applications is $18 billion by 2026.
The concept of a 360-degree view is vital for businesses to function while predicting customer needs. This paves the path for meaningful insights and allows for more personalized interaction. The benefits of this method are listed below.
1. Superior Customer Understanding: The 360-degree view allows business owners to predict customers’ needs, allowing for more personalized interactions and rapport-building.
2. Personalized Marketing: Businesses can understand the customer’s preferences through the customer journey map. This map enables businesses to unravel customers’ thinking and curate marketing strategies, ensuring higher engagement and conversion rates.
3. Improved Customer Service: A 360-view means that the service representatives can access a customer’s entire history. Based on the client’s past behavior patterns, this method provides customizations. This personalization is evident in their interactions with you. In turn, it boosts customer satisfaction.
4. Operational Efficiency: With 360-degree view data collection, businesses can streamline their processes, making operations smoother and more efficient. The 360-degree customer view is a method that has revolutionized customer-service provider interactions. These conversations give clients a unified view of the customer’s journey. They also enable collaboration between different departments.
Why Do You Need a BI Strategy for Your Financial Business?
Technology is rapidly growing, and the amount of data generated in today’s business world is enormous. We create around 2.5 quintillion bytes of data every day!
Legacy financial processes have started failing. They don’t have the right tools to handle this much data. An efficient business intelligence strategy would be your knight in shining armor. It enables you to measure and evaluate performance. You can also identify competitive advantages and make informed, data-driven decisions. Other reasons why you should install this technology into your financial services include:
1. Better Decision Making
Business Intelligence implements Predictive Analysis to enrich the decision-making process. This derivative of AI can learn encoded data, recognize recurring patterns, and make accurate predictions. This greater visibility into potential outcomes based on past performances is the best tool for a business. Companies with an efficient BI strategy can gain insights on their customer behavior. This arms them with the ability to anticipate trends in the market and adjust business operations accordingly. Subsequently, the company’s risk of losses due to market shifts also drops.
Additionally, Business Intelligence improves communication between departments within the company. Employees can share meaningful insights from various datasets, removing the need to rely on anecdotal evidence. Working together towards a shared goal will boost efficiency and increase profits.
2. Increased Operational Efficiency
With a strong BI strategy, companies can streamline internal processes. They can also analyze employee behavior and performance to uncover hidden talent. Data analytics, a subset of BI, can shed light on how to optimize efficiencies within the organization. Companies with BI systems generally switch from manual, time-consuming labor to automated systems, which makes them more agile and frees up resources.
3. Solid Risk Management
Predictive Analytics and Machine Learning are potent tools for a business owner. These systems can also assess risks while predicting future trends. With these risk insights, companies can avoid making certain investments and commitments. This will help companies reduce losses that could hurt their bottom line if left unchecked.
4. Boosts Customer Retention
Financial business intelligence equips you with the most current information on customers. Banking and finance institutions can keep their marketing and sales teams armed. With BI’s help, your teams can recognize the organization’s most loyal and profitable clients. This information is gold as teams can concentrate their efforts on retaining these customers. They can also gain insight into the kind of customer that they can attract to their business,
5. Offers Competitive Edge
Due to its long list of perks, the BI strategy has the power to give you a strong competitive edge in the market. It also helps you streamline the best BI solution vendor for your financial business. These services are also integrated with superior features.
6. Reducing Costs
Cost-effectiveness is a quality check for the business intelligence strategy you use. Using predictive analytics and other BI tools, budgeting becomes more precise. Resource allocation is thus streamlined, and opportunities for cost reduction are identified; an efficient BI strategy will oversee training offerings and associated costs as well. This will help you budget and reduce unforeseen spending.
How Is AI Transforming Financial Services: Use Case and Applications
How Can You Build a Successful BI Strategy for Your Financial Services Business?
A solid BI strategy can improve customer retention, optimize costs, and provide competitive advantages. It is vital for your plans and business goals to align with your Business Intelligence strategy to make it a success. Here are the key steps involved in building an efficient BI strategy:
1. Assess and Define Your BI Ecosystem
Gather all the information you need before embarking on this journey. A sound data plan is vital for your implementation. It should include identifying data sources and visualizing a strategy. Gather relevance from your data sources (clients, projects, sales, marketing, finance, etc.) You can organize them by department, function, or business impact to streamline the process. Visualizing a strategy will encompass discussing the company’s vision with stakeholders. Create an alluring presentation for them with the help of a designer. In your presentation, be sure to highlight the reasons and benefits of a BI strategy.
2. Budgeting
Your immediate next step is to develop an accurate budget. Without planning, the BI strategy implementation process can be expensive and can cause financial strain for the company. Developing a strategy beforehand will prepare you for any unforeseen expenditure.
3. Assemble Your BI Team
Select a group of proficient employees to work as your BI implementation team. Include company stakeholders in the team to keep them in the loop. Your team should include an HR employee, a scheduling officer, one from the union, and a legal assistant. This will be your army, as it were, so ensure you make the right choices.
4. Choose Your BI Platform
Your business goals are bound to change. Aim to install BI software that provides self-service templates and easy usability for beginners. This step is very important because it will define how your company is affected during and after implementation. Take your time, explore various platforms, and carefully make your pick.
5. Select Your BI Software Partner
This is a delicate journey. Be bold and decisive when you reach this step. Remember that the partner you choose will guide you throughout. Compare different partners to rate their different features. Lastly, combine this with previous reports and review them. Conducting demos is the most effective method for this step.
6. Plan User Training
Imagine if, after all the effort put into implementation, no employee is equipped to handle the aftermath. A true disaster! This is why planning early user training is so important. Once you have decided on a service provider, it’s time to plan your training program. Sometimes, service providers provide video training and live classes. This helps users set up and get familiar with the software. Training will help employees stay updated on insights and learn the best features.
7. Refine Your Data
This is the last stage of preparation to build a successful BI strategy. Refine your data structures and remove waste. The cleanest data possible will yield the best productivity results. The quality of data you enter into Power BI will affect the quality of insights you get, so it’s crucial not to underestimate this step.
How Does Business Intelligence Benefit Financial Services?
A solid BI strategy can improve customer retention, optimize costs, and provide competitive advantages. Here are some top benefits of implementing BI into your financial service strategy:
- Real-time insights: Financial BI can spontaneously access any financial data recorded, allowing for quicker and more informed decision-making.
- Improved reporting: Writing reports is a tedious job that can be automated with financial BI. This frees up employees to take part in analysis and interpretation.
- Cost savings and revenue growth: Financial BI can help businesses recognize areas of incompetence, cut costs, and discover new revenue streams.
- Increased efficiency: Financial BI can automate and streamline financial processes, reducing manual work and avoiding the risk of human error.
- Transparency and collaboration: With financial BI, communication between other departments and finance is reinforced.
How Can Fingent Help in Bringing Business Intelligence to Your Financial Service?
Fingent is known for using cutting-edge technology to ensure the best outcomes for clients. These technologies include machine learning, natural language processing, and more. These can be fashioned into valuable Business Intelligence tools customized for your business.
We can help your financial organization stay ahead of the competition. The software designed for you will ensure that your organization remains resilient regardless of any form of disruptive circumstance. Experts at Fingent empower businesses to maintain momentum with new developments. They also measure the effect of changes on customer requirements. Our custom software development experts at Fingent can help you understand everything you need to know about business intelligence.
Stay up to date on what's new

About the Author

Featured Blogs


Stay up to date on
what's new


Talk To Our Experts
Today, technology seamlessly weaves its way into every aspect of our daily lives. That’s precisely what digital transformation is all about – a process that enables businesses to harness the power of cutting-edge technologies and revolutionize the way they operate, engage with customers, and flourish in today’s fast-paced world.
Digital transformation goes beyond a mere trend; it’s a profound shift that can reshape the very core of a business. It allows organizations to metamorphose and emerge stronger and more adaptable than ever before.
In this blog, we’ll embark on an exciting journey to understand the significance of digital transformation, explore its key components, and learn from real-world examples of successful transformations. We will understand why it holds the key to shaping the future of businesses worldwide.
Understanding Digital Transformation
Imagine taking your cherished family recipe and giving it a modern twist with new ingredients, cooking techniques, and flavors. That’s the magic of digital transformation – a process that revitalizes businesses by infusing cutting-edge technologies into their core operations, just like the innovative twist to your traditional recipe!
Which digital technologies enable transformation?
Digital technologies, like cloud computing, Artificial Intelligence (AI), and the Internet of Things (IoT), play a vital role in the business landscape.
The cloud is like a virtual pantry that stores all your ingredients and tools, making them accessible from anywhere at any time. AI acts as your sous-chef, analyzing data, providing insights, and making your decisions more intelligent. Meanwhile, the IoT is the magic ingredient that connects everything, enabling devices to communicate and create a harmonious cooking experience.
The Digital Metamorphosis: Embracing the Ever-Evolving Adventure of Growth
Digital transformation is a thrilling quest to become the best version of what your business is capable of becoming. It’s not a one-time makeover or a sudden transformation, but a continuous journey of growth and improvement. Just like you set new goals and work towards them over time, businesses must shift their perspective from considering digital transformation as a one-time project to embracing it as an ongoing process.
This journey requires a mindset shift – instead of seeking instant results; businesses must focus on long-term gains and stay committed to the process. Digital transformation demands consistent effort and dedication, as every step contributes to overall success.
Benefits and Outcomes of Digital Transformation
The benefits of digital transformation are many, and you will discover more of them as you implement it in your business, but here are a few of its main benefits.
- Enhanced Productivity: Digital transformation ensures mundane tasks vanish from your to-do list, leaving businesses with more time and energy to focus on what truly matters.
- Delightful Customer Experiences: Businesses become experts in customer satisfaction through personalized interactions, seamless online shopping, and responsive customer service.
- Unleashing Agility: Digital transformation enables businesses to respond swiftly to changes and opportunities. They can adapt their strategies, offerings, and operations in the blink of an eye, staying ahead of the competition.
- Unraveling Insights: Digital transformation empowers businesses to harness the power of data, uncovering valuable patterns and trends. These insights guide businesses toward smarter decisions and growth like a treasure map.
- Flourishing in the Digital Kingdom: In this captivating realm, businesses hold a golden scepter of competitive advantage. Digital transformation sets them apart from their rivals, like a crown that marks them as the industry’s leaders. They become the beacon of innovation, drawing customers to their kingdom of products and services.
- Securing the Castle: Digital transformation fortifies its defenses against cyber threats and data breaches. It’s like having a strong shield that safeguards their reputation, customer trust, and sensitive information.
- Sustaining Everlasting Success: Digital transformation is not a one-time invocation but a perpetual journey of growth and adaptation. With every step, businesses evolve and renew their charm, ensuring a legacy of prosperity.
Read more: Is Open Source the Crucial Catalyst For Digital Transformation?

Overcoming Challenges and Embracing Opportunities
A digital transformation journey can empower businesses with the tools they need to thrive in a technology-driven landscape. However, this metamorphosis comes with its own set of challenges and considerations. Let’s dive into these hurdles and discover how to overcome them while achieving your organization’s goals.
1. Organizational Culture and Mindset Shift
- Challenge: The resistance to change can be deeply embedded within an organization’s culture.
- Consideration: Cultivate a growth-oriented mindset that embraces innovation and adapts to new technologies.
- Approach: Foster a culture that rewards risk-taking and encourages open communication to build trust.
2. Change Management and Employee Buy-In
- Challenge: Employees may fear the unknown and be reluctant to embrace new processes or technologies.
- Consideration: Engage employees early on in the transformation process and communicate the vision clearly.
- Approach: Encourage two-way communication, provide training and support, and celebrate small wins to build momentum.
3. Legacy Systems and Technology Integration
- Challenge: Integrating new technologies with existing legacy systems can be complex and time-consuming.
- Consideration: Evaluate the compatibility of existing systems with the new solutions you plan to implement.
- Approach: Develop a well-thought-out integration strategy, and consider phased implementations to minimize disruption.
4. Data Privacy and Security Concerns
- Challenge: The digital era brings increased risks of data breaches and privacy violations.
- Consideration: Safeguard customer and company data to build trust and maintain regulatory compliance.
- Approach: Implement robust security measures, regularly audit systems, and ensure employee awareness of data protection practices.
5. Skills Gap and Talent Acquisition
- Challenge: Finding skilled talent with expertise in emerging technologies can be challenging.
- Consideration: Upskill current employees and promote a learning culture to bridge the skills gap.
- Approach: Collaborate with educational institutions, offer training programs, and consider hiring freelancers or partnering with external experts.
Watch now: 7 Deadly Mistakes Non-Tech Businesses Make on Tech Projects
Success Stories: Real-World Examples
As businesses brace themselves for their journey, they seek inspiration from the tales of industry leaders like Amazon and Netflix. These titans have undergone remarkable digital transformations, leveraging technology to disrupt markets and revolutionize customer experiences.
Staying Relevant like Amazon and Netflix!
- Challenge: Amazon began as an online bookstore, and Netflix was a DVD rental service. Both companies recognized the need to adapt and evolve to stay relevant in the ever-changing digital landscape.
- Solution: Amazon expanded its product range, becoming an online marketplace for various goods and services, leveraging technology to optimize customer experience and supply chain efficiency. Netflix transitioned from a DVD rental service to a digital streaming platform, investing in content creation and personalization algorithms to offer a superior streaming experience.
- Takeaway: Embrace innovation and be willing to pivot when necessary to meet evolving market demands. Continuously focus on improving customer experience to build loyalty and attract new customers. Leverage technology to streamline operations and enhance efficiency.
Unifying and Protecting Data in Healthcare like John Muir Health!
- Challenge: Healthcare companies are often concerned about data security and interoperability while implementing electronic health records (EHRs).
- Solution: Healthcare providers invested in robust cybersecurity measures and interoperable EHR systems to protect patient data and facilitate efficient communication among healthcare professionals. An example is John Muir Health, which “leverages a cutting-edge data platform to unify data while also using the cloud to improve real-time patient communication. As a result, patients can ask questions and receive information through their preferred communication channel, such as email or SMS.”
- Takeaway: Understand the unique challenges of your sector and tailor the digital transformation strategy accordingly. Collaborate with industry experts and technology partners to implement suitable solutions.
Creating Seamless Experiences in Retail like Ikea!
- Challenge: Retailers struggled to bridge the gap between physical stores and online shopping, creating a seamless omnichannel experience.
- Solution: Retailers adopted advanced analytics and inventory management systems to optimize stock levels and offer personalized recommendations to customers across various channels. Ikea, for example, tripled their online sales by prioritizing the digital side of their business!
- Takeaway: Continuously monitor and adapt to the changing needs of customers and the market.
Thriving in the Digital Age: Fingent’s Unparalleled Support for Transformation
The key to sustained business success lies in continuous innovation and adaptation. As organizations strive to remain competitive and relevant, embracing digital transformation becomes imperative. Throughout this journey, Fingent emerges as a trusted partner, offering comprehensive solutions and unparalleled expertise to empower businesses and drive growth.
Fingent’s commitment to excellence and wealth of experience in guiding organizations through successful digital transformations make us a beacon of reliability. By understanding the unique challenges of each industry and sector, we tailor our solutions to meet the specific needs of our clients. From industry giants to startups, Fingent collaborates closely with organizations of all sizes, ensuring that no one is left behind in this technological revolution.
By fostering a culture of innovation and providing the necessary support and training, Fingent top custom software development company helps employees embrace the digital shift with enthusiasm and confidence. Our meticulous planning and phased implementation approach ensure a seamless transition, minimizing disruption and maximizing efficiency.
Reach out to us, and let’s lead you to success on your digital transformation journey.
Stay up to date on what's new
About the Author
Featured Blogs
Stay up to date on
what's new
Talk To Our Experts
Business Intelligence in Finance becomes the most trusted aide of the modern CFO. Here’s how BI helps finance teams to leverage insights and drive the business forward.
Business Intelligence In Finance: A CFO’s Most Reliable Tool
In 2020 alone, 64.2ZB of data was created or replicated by many industries. However, 73% of the enterprise data is left unused for business analytics and intelligence. Several studies prove that business intelligence in finance enables enterprises to reap ROI and profitability and boost customer retention. In one of its recent reports, Tech Jury reveals that effective utilization of big data allowed Netflix to save $1 billion per year on customer retention.
Is Business Intelligence worth putting time into? If you’re a CFO, then it might be a good idea to investigate this further. After all, time is worth money, and BI does come with costs.
In our experience, we know that it is worth it. A CFO can use BI to harvest business-critical insights and drive value through process improvement. This blog presents some key facts that show why Business Intelligence in finance is crucial for CFOs.
Read more: How Odoo ERP Helps Leverage Business Intelligence and Data Analytics
What Is Business Intelligence?
Business Intelligence is a tool that is often misunderstood and usually underutilized by finance organizations. Business Intelligence in banking uses analytics software to create interactive data visualization. BI covers a broader range of functions that include querying, data mining, data preparation, and so on.
Data thus collected is an invaluable asset that allows finance organizations to understand themselves better and make informed decisions.
Read more: Business Intelligence 101
Why Must CFOs Understand The Significance Of BI In Finance?
As financial organizations recover from the devastating blow of COVID-19, CFOs must look beyond managing costs to discovering new opportunities to plan business. CFOs can pursue these opportunities with the help of BI solutions.
Financial services are awash by terabytes of data pouring in each day. To manage a financial organization successfully, CFOs must understand that data quickly and in a targeted manner. Business Intelligence tools can draw data from internal and external sources for centralized and comprehensive data management and analysis.
A Business Intelligence (BI) tool will help CFOs infer the potential market and business opportunities, identify value drivers for growth opportunities, and then track KPIs against those. A well-implemented BI tool can assist CFOs in handling real-time data quickly and precisely. Business intelligence in finance enables CFOs to correlate between investments and profitability across multiple dimensions of your financial organization.
Such analysis will help CFOs further strategize on valuation or growth optimization. As a result of that solid proof, the finance organization can improve overall services and create future go-to-market strategies.
By focusing on strategic value through BI, CFOs can enable their organization to become resilient and agile. These traits are crucial now than ever before, given the need to mitigate risk while navigating potent disruptors like a global pandemic.
Read more: Business Intelligence in SAP: How It Helps You Become a Data-driven Organization

How BI Can Enhance The Role Of The CFO
Business Intelligence combines proactive data management with process automation and business analytics. By using this combination, CFOs can make several critical improvements within their organization, such as:
1. Clear and Complete Data
The CFO needs to know what is happening in the company to help him develop and implement refinements. BI tools can help CFO and his team to:
- Integrate and standardize existing software environment
- Eliminate human error
- Automate key processes that boost speed and accuracy
- Eliminate data silos
- Perform advanced data analysis tasks
The BI tools use ML to bring data together in a secure, well-managed data warehouse. These tools will clarify and organize your information, assisting CFOs to make the best decision possible. BI can benefit:
- Real-time working capital analysis and management
- Advanced budgeting and forecasting
- Preparation and distribution of critical financial statements
2. Data Visualization
CFOs need to make crucial decisions in real-time. However, looking through pie charts or reams of printouts can be time-consuming and delay the process of decision-making. Finance leaders can tackle this challenge easily with the help of business intelligence tools.
Read more: How Fingent Helps CFOs Gain New Insights and Reliably Enable Key Decisions

Business Intelligence uses data analytics to make insights available faster and with greater clarity. Hence, it can generate concise visualizations that bring additional value to the process. Such data visualizations help CFOs examine the connection of seemingly disparate data sets.
The CFO can use visualization to develop new products that will attract a key demographic and increase their average spend. Also, it will help them identify saving opportunities in the supply chain. BI uses advanced technologies to create heat maps, interactive augmented reality applications, and data dashboards. These will assist in tracking business performance and strategizing effectively to reduce the risk or increase profitability.
Read more: How Data Warehousing Adds Value To Data Visualization & Reporting
3. Risk Mitigation
The banking and finance sector faces unprecedented business disruptors creating uncertainty in business growth. With the help of BI tools, CFOs and their teams can organize all their data for real-time access and analysis.
Finance professionals can use these metrics to monitor and evaluate internal processes and detect and reduce fraudulent activities to minimize risk. This provides context and clarity and helps companies identify invoice fraud and improve internal compliance.
Business intelligence tools can be integrated with analytics capabilities to measure, identify, track, and analyze operations.
Read more: Transforming The CFO into a Business Value Creator and Role Model

4. Operation and Performance Management
Synchronizing the organization to build resilient operations has never been easy. The efficiency of management alone will not suffice. A well-known business benefit of BI tools is performance management capabilities. This will help you identify your business performance at every level. You can conduct a performance and operational health check regularly.
5. Identify Potential Weaknesses in Business
Growth will suffer if a business’s weakness goes undetected. A CFO and their team can identify incomplete or inconsistent data with the help of accurate and comprehensive data. This will reveal potential flaws in specific controls and processes.
6. Improved Customer Service and Retention
Finance organizations must understand why their customers might be inclined to move to the competition to stay ahead of the competition. BI tools reveal customer requirements because they identify the customers spending patterns. This data helps organizations to improvise and provide services that procure customer loyalty.
7. Predict Future Trends
A smart CFO will always have their gaze fixed on the future. Therefore, the CFO will want to explore and make predictions about future trends and prepare their finance organization with the future in mind. Instead of relying on old methods, CFOs can use BI tools to make predictions for the future of their organization and deliver clear plans that find sure success.
Read more: Reimagine Your Business Intelligence With Dynamic Visual Storytelling Using SAP Analytics Cloud

Make Better, Intelligent, Informed Decisions – Starting Now!
Equipped with valuable data, a CFO can make intelligent, informed decisions and help their financial organization stay ahead of the curve. They can also ensure that their organization remains resilient under disruptive circumstances. Thus, they can enable their business to maintain momentum with new developments, detect market changes, and measure the effect of changes on customer requirements. If you are a CFO, you need to get on board with the best way to maximize your Business Intelligence. Custom software development experts at Fingent can help you understand how. So give us a call, and let’s get talking.
Stay up to date on what's new
About the Author

Featured Blogs
Stay up to date on
what's new
Talk To Our Experts
How Business Intelligence in SAP Helps You Become a Data-driven Organization
Business Intelligence is the data powerhouse essential for the survival of your business. BI can help organizations evaluate and transform complex data into meaningful, actionable information. This information allows organizations to generate operational insights and supports effective, strategic, and tactical decision-making. Business Intelligence in SAP makes data-driven decision-making better, faster, and more effective. This article helps you understand all you need to know about Business Intelligence in SAP.
Read more: SAP for Business: 9 Ways to Maximize Business Performance

Business Intelligence in SAP
Business Intelligence in SAP is a centralized suite for data analysis and reporting. It allows you to gain data from multiple data sources and distribute it to different Business Intelligent systems. In essence, Business Intelligence in SAP can work as a target system for data transfer or a source system for data distribution.
Business Intelligence in SAP allows an organization to share information in real-time with all involved, from the CEO to lower-level employees. It offers a panoramic view of data to all those with appropriate credentials. Business Intelligence in SAP can be customized easily to your specific needs. This would also mean that you can access the information much faster.
Read more: How SAP Supports Effective Business Continuity Planning

Advantages of Business Intelligence in SAP
According to Statista, the global market size for business intelligence (BI) and analytics software applications is forecast to touch USD 17.6 billion by 2024. Such an increase is a clear indication of the wide range of benefits Business Intelligence in SAP can offer organizations.
Here are a few advantages of Business Intelligence in SAP:
1. An entire range of BI-related products
SAP offers all the BI tools necessary for your company to leverage a data platform. Business Intelligence in SAP allows you to deploy these tools according to your requirement. The BI tools can be used for querying, analyzing, and reporting. You can also use them to identify trends in the data and discover any underlying issue that adversely affects the business.
SAP Analytics Cloud allows you to centralize your BI tools. From this central point, you can provide permission-based data access to the employees according to their job requirements. Additionally, ad hoc reporting tools enable you to formulate questions and find instant answers. You can gather these answers and data into valuable insight, which can be shared with the rest of the relevant employees.
Read more: 7 Crucial Business Challenges Solved by SAP Analytics Cloud

2. Information at your fingertips
Business Intelligence in SAP comes with an enterprise-wide sharing functionality. It simplifies the data to be understood easily in common business terms rather than complex semantic language. Simplifying data makes it easy to search for critical information and gain valuable insights.
Moreover, data simplification and insights generation allow you to share your findings and insights with other users across your organization. For good decision-making, businesses need valuable insights into various business modules such as finance, sales, operations, and human resources. Business intelligence combines all the views from these modules to provide more accurate information. Now, each decision-maker is armed with relevant information to make critical decisions that affect your organization.
3. Self-service visualization capabilities
Dragging data from vast storage and introducing it to a user is a gigantic task that requires data-specific knowledge and engineering skills. SAP offers several self-service tools for BI users. The self-service visualization capabilities of Business Intelligence in SAP allow its users to view and analyze data more efficiently. With this capability, you can aggregate data, conduct trend analysis, and uncover valuable insights. This can reduce maintenance costs while considerably shrinking the time spent on reporting-related tasks.
Read more: How Fingent Helps CFOs Gain New Insights and Reliably Enable Key Decisions
4. Ability to create interactive BI dashboards
Business Intelligence in SAP enables you to create interactive BI dashboards that can be customized for each user. Additionally, decision-makers can access and view these dashboards from anywhere and at any given time.
You can access the dashboards via smartphones. The dashboards are also accessible through browsers, applications, or desktop widgets, even when you are offline. It means that all users can remain connected to the company’s server at all times.
5. Integration with MS Office application
You can realize the true value of the data you possess if only you share those insights and reports with other users. Since most reporting and dashboard modules are integrated with sharing capabilities, your employees can easily share valuable insights. Integration with the MS Office application allows users to perform data analysis in multiple dimensions. It enables them to manipulate and filter data dynamically.
Business Intelligence in SAP allows you to import large amounts of data to MS Excel, enabling you to analyze and forecast effectively. You can also embed information into MS PowerPoint. This feature is helpful when you need to present business insights to stakeholders and colleagues.
6. Easy to use interface
Business Intelligence tools can be very complicated, with a complex interface designed mainly for skilled programmers or data analysts. However, Business Intelligence in SAP comes with a good instrument that allows for an intuitive user interface. With a bit of time and skill, it is easy to master the interface. Onboarding a new business user becomes more convenient as they can access all the instruments from a single web-based interface.
7. Greater flexibility and scalability
Business Intelligence in SAP is easy to integrate as it offers deployment options for most of its products. As Business Intelligence in SAP is service-oriented, it is easily scalable. Based on the need of the hour, businesses can either increase or decrease. Though you begin using business intelligence for a single project, later, you can expand to the rest of the organization. It means that both large enterprises and small businesses can benefit from Business Intelligence in SAP.
8. Allows your IT department to engage in more meaningful work
Business Intelligence in SAP can automate mundane and time-consuming tasks. It also ensures that the employees in your organization have all the resources they need to perform their tasks. It reduces the dependency on your IT department and helps your IT professionals focus their time on more productive and relevant jobs.
Read more: Top 7 Business Benefits of Adopting SAP Intelligent Robotic Process Automation

Bottom line
Easier access to data, smarter insights, better business – you can’t go wrong with Business Intelligence in SAP. It helps you run complex queries and provides you with a highly scalable solution. What more can you ask for?
Fingent is an SAP Silver Partner and is well-placed to help you get started with your BI journey. Get in touch with us and transform your business into a data-driven organization.
Stay up to date on what's new
About the Author

Featured Blogs
Stay up to date on
what's new
Talk To Our Experts
Can Data Warehousing Enhance the Value of Data Visualization & Reporting?
Organizations rely heavily on data to make crucial business decisions. Hence, it is important for your business to have access to relevant data. That is where a well-designed data warehousing comes to your rescue!
Besides gaining actionable insights, corporate executives, business managers, and other end-users make more informed business decisions based on historical data.
Today’s Analytics and Business Intelligence solutions provide the ability to:
- Optimize business processes within your organization
- Increase your operational efficiency
- Identify market trends
- Drive new revenues
- Forecast future probabilities and trends
Before understanding how data warehousing can add more value to data visualization and reporting, let’s take a look at what these terms mean.
Analytics and Business Intelligence
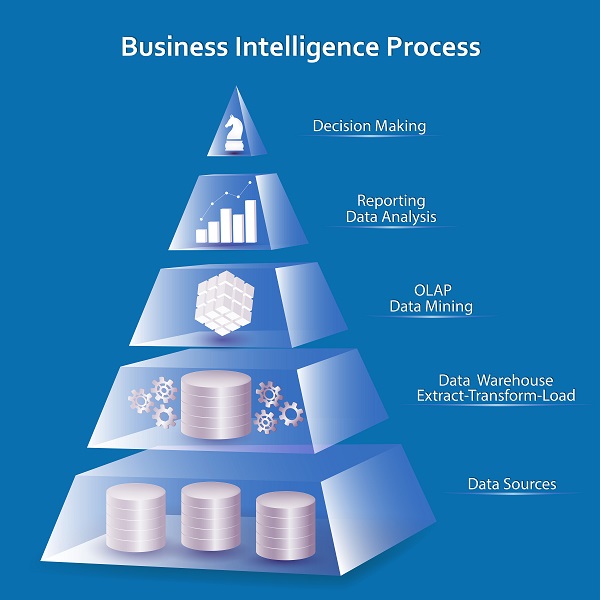
Business Intelligence is a process that includes the tools and technologies to convert data from operational systems into a meaningful and useful format. This helps organizations analyze and develop meaningful insights to take timely business decisions. The information derived from these tools demonstrate the root cause of your business problems and allow decision-makers to strategize their plans based on the analysis.
Business Intelligence is information not just derived from a single place, but multiple locations and sources. It can be a combination of the external data derived from the market and the financial and operational data of an organization that is meaningfully applied to create the “intelligence”.
Data Warehouse
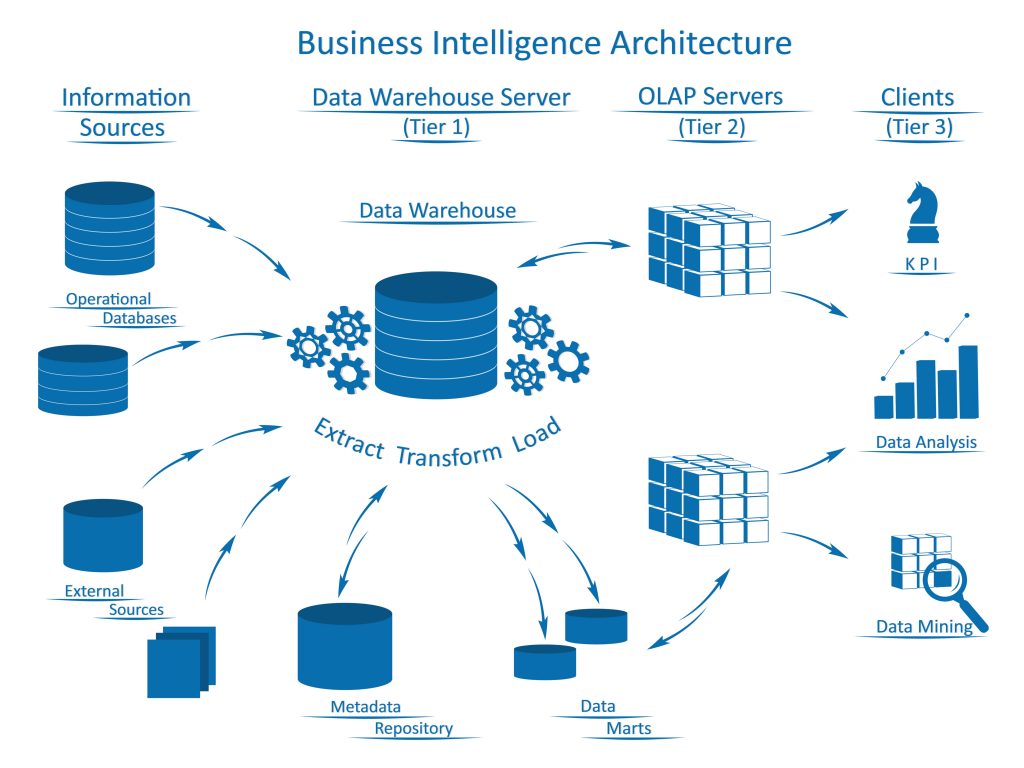
Data warehouse is a repository that collects data from various data sources of an organization and arranges it into a structured format. An ideal data warehouse set up will extract, organize, and aggregate data for efficient comparison and analysis. Data warehouse supports organizations in reporting and data analysis by analyzing their current and historical data. This makes it a core component of Business Intelligence.
Unlike a database, that stores data within, at a fully normalized or third normal form (3NF), a data warehouse keeps the data in a denormalized form. It means that data is converted to 2NF from 3NF and hence, is called Big Data.
Key benefits of a Data Warehouse
- Combine data from heterogeneous systems
- Optimized for decision support applications
- Storage of historical and current data
Why We Need Data Warehouse for Business Intelligence?
Before the business intelligence approach came into use, companies used to analyze their business operations using decision support applications connected to their Online Transaction Systems (OLTP). Queries or reports were retrieved directly from these systems.
However, this approach was not ideal due to:
- Quality issues
- Reports and queries were affecting business transaction performance
- Data resides in heterogeneous sources
- Non-availability of historical data
- Non-availability of data in the exact form required for reporting
Connecting your organization’s business intelligence tools to a data warehouse can provide you benefits in terms of production, transportation, and sale of products.
Data Visualization vs. Data Analytics – What’s the Difference?
Data Warehousing and Business Intelligence Using AWS
Today, traditional BI has given way to agile BI where agile software development accelerates business intelligence for faster results and more adaptability. Big Data is growing fast to provide useful insights for making improved business decisions.
There has been a paradigm shift in data storage with warehousing solutions moving increasingly to the cloud. Amazon Redshift, for instance, is one of the most popular cloud services from Amazon Web Services (AWS). Redshift is a fully-managed analytical data warehouse on cloud, that can handle petabyte-scale data, which enables analysts to process queries in seconds.
Redshift offers several advantages over traditional data warehouses. It provides high scalability using Amazon’s cloud infrastructure to set-up and for maintenance, without the need for upfront payments. You can either add nodes to a Redshift cluster or create additional Redshift clusters to support your scalability needs.
You can use AWS Marketplace ISV Solutions for Data Visualization, Reporting, and Analysis.
Data visualization helps you identify areas that need attention or improvement, clarify factors that influence business such as customer behavior, and making decisions such as finding out a suitable market for your product or predicting your sales volumes, and much more.
TIBCO Jaspersoft, for example, is a solution that delivers embedded BI, production reporting, and self-service reporting for your Amazon data at affordable rates. It features the ability to auto-detect and quickly connect to Amazon RDS and Amazon Redshift. Jaspersoft is available in the AWS Marketplace in both single-tenant and multi-tenant versions. TIBCO Jaspersoft for AWS includes the ability to launch in a high availability cluster (HA) as well as with Amazon RDS as a fault-tolerant repository. Pricing is based on the Amazon EC2 instance, type as well as the chosen single or multi-tenant mode.
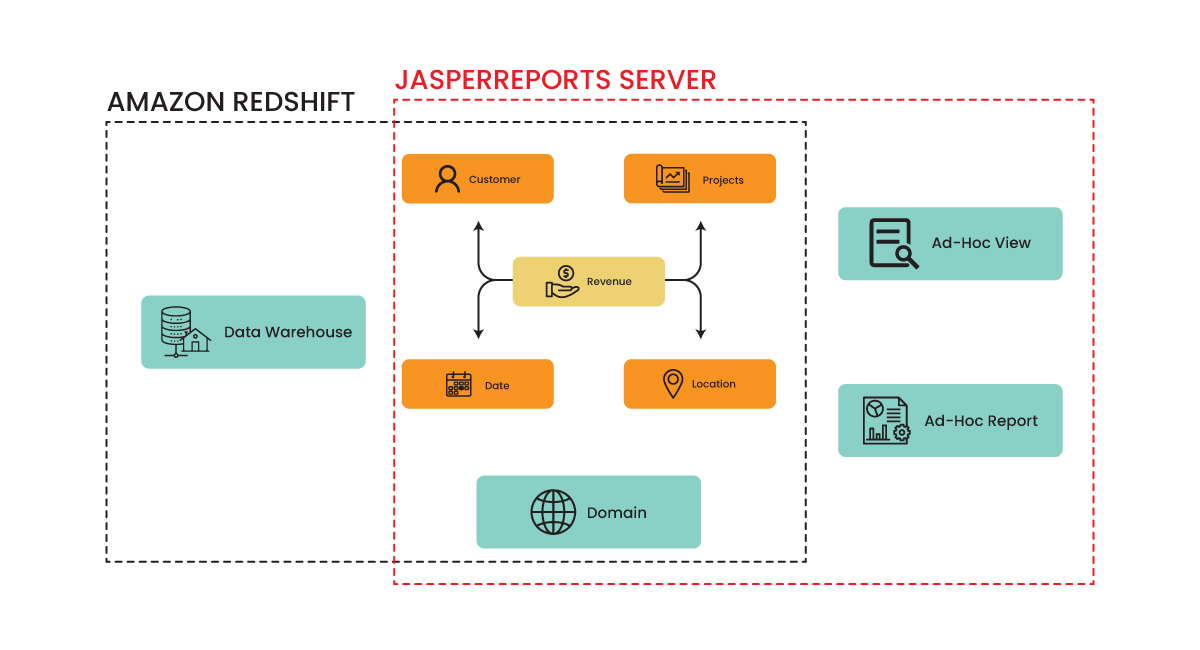 Image source: http://bit.ly/2IWWCDn
Summary
By moving your analytics and business intelligence to a hybrid cloud architecture you will be able to handle huge amounts of data and scale at the rate of expansion required by your business. You will also be able to deliver information and solutions at the speed that your employees and customers demand, and gain insights that will enable your organization to innovate faster than ever.
Business Intelligence and Data Warehousing are two important aspects of the survival of any business. These technologies give accurate, comprehensive, integrated, and up-to-date information on the current enterprise scenario which allows you to take the required steps and make crucial decisions for your company’s growth. To know how your business can benefit from the latest technologies, get in touch with our custom software development experts today!
Stay up to date on what's new
About the Author

Featured Blogs
Stay up to date on
what's new
Talk To Our Experts
A Comparison Between Tableau and Power BI: The Most Powerful Leaders In The BI Market.
Business Intelligence or BI tools are a precursor of the world-altering digital technology in this modern technology landscape. Analytics plays a key role in determining which Business Intelligence tool is a better choice. This is because the more flexible the analytics platform offered by a specific BI tool is, the more it provides businesses to customize applications that need updates. Let’s take a deeper look at how Power BI is different from Tableau and which technology promises a better future for your business.
Related Reading: Read on to learn more about Business Intelligence. What it is and how your business can get the best from it.
Tableau And Power BI
Tableau was the first and foremost to come into the market. Though both Tableau and Power BI are well-known to be able to execute fine enough, Power BI has an advantage of making itself accessible to even the no-techy users, making it possess a higher adoption rate than Tableau.
On the other hand, Power BI is ranked higher on one of the key characteristics in terms of its Data Visualization, according to Gartner’s Magic Quadrant.
However, Microsoft’s Power BI has the most user-friendly features in terms of ‘completeness of vision’ or ‘Data Visualization’ capability and has been embedded within Office 365. But Tableau offers advanced functionality and it is best considered for power users.
So to choose a BI tool that is the best fit for your business, it is important to first learn about the analysis needs. In the recent decade, Power-BI and Tableau have emerged as the two powerful BI tools.
Let us look at how companies can choose the best for their business from the following key factors:
Cost
Cost of Tableau is on the higher side when it comes to larger enterprises. The primary reason for this premium cost is the need to build data warehousing. Thus, it is advisable for a startup to choose Power BI initially and then consider Tableau when required.
The professional version of Power BI costs you less than 10$ whereas, on the other end, Tableau would cost you more than 35$ per month per user.
Reporting
Power BI supports Predictive Modelling and Reporting when on the other side, Tableau opts for Data Visualization.
With Power BI, we can create visualizations by queries and natural language. Say, for instance, Cortana PDA (Personal Digital Assistant). Power BI is said to place a 3500 limit when it comes to conducting analysis on data sets.
Tableau can be the best choice when it comes to Data Visualization. With a user-friendly dashboard, Tableau allows an in-depth data analysis. As compared with Power BI, Tableau offers more visualization flexibility.
With Tableau, we are able to create 24 different types of basic visualizations. This includes heat maps and line charts.
Functionality
The functionality associated with Tableau with respect to Data Searching is on the higher side than when compared to that of Power BI.
Tableau tends to answer more queries from users as compared to Power BI.
Large Data Handling Capacities
In case of processing large chunks of data, the capacity of Tableau is over and above that of Power BI.
Power Bi handles data via import functionality and hence is slower to process large volumes of data as compared to Tableau that makes use of direct connections for the same purpose.
Data Connectors
Tableau offers, convenience for data connectors. For example, OLAP (OnLine Analytical Processing), cloud and also big data options such as Hadoop and NoSQL. Tableau can automatically determine the relationships of data that users add from various data sources. It also provides for the creation and modification of data links manually as per the company policies.
Power BI, on the other hand, can connect to user’s external sources such as SAP HANA, MySQL and JSON. It helps users connect to third-party databases and online services like Salesforce.
Thus, if connecting to a specific data house is your business requirement, Tableau is the best choice as Power BI is integrated with Microsoft’s Azure cloud platform.
Related Reading: Business Intelligence or Business Analytics. Find what is best for your business.
Deployment
Power BI is a SAAS model. Tableau, on the other hand, is available both on cloud and on-premises options. The deployment options for Power BI is lower as some business policies do not allow for SAAS deployment. Thus, in case of flexible deployment capacity, Tableau is considered the better option here, even though it is on the higher-end when the cost factor is considered.
User Interface
The user interface of Tableau allows for the creation of a customized dashboard. On the other hand, Power BI has an interface that is easy to use and intuitive. So, if easy to use is your major requisite, Power BI is the choice for your business.
Programming Tools Support
Though both Power BI and Tableau run smoothly with programming languages, Tableau can be integrated better with the R language rather than Power BI. R language provides a wide range of tools used to capture the right model of your data.
Power BI, on the other hand, also can be connected to the R language, but by using Microsoft Revolution analytics and it is made available only for Enterprise users.
Product and Customer Support
Tableau emerged in an early stage than Power BI and hence has a smaller community when compared to Tableau. The knowledge base of Tableau has three subscription categories, namely Desktop, Online, and Server.
On the other hand, Power BI offers a support functionality that is limited to users with a free account, allowing only it’s premium and pro users for faster support.
Licensing
This ultimately depends on whether you want to pay the full cost up front. If yes, then Tableau should be your first choice.
If we could put it this way, Power BI can be your best choice if you are a common stakeholder because of its intuitive drag and drop features, for which a data analyst’s experience is not crucial. Tableau can win if your choice is speed and if you have the capital to support.
Related Reading: Find how SAP HANA is becoming the game changer.
In a nutshell, both Power BI and Tableau have different functionalities which depend on the variant business requirements. The best BI tool for your business can be selected only depending on the business requirements. Partnering with a software development company can provide businesses with access to expert IT consultants who can help make informed technology decisions. At Fingent, our team of consultants can guide you in making the right choices for your business. Contact us today to learn more.
Stay up to date on what's new
About the Author

Featured Blogs
Stay up to date on
what's new
Talk To Our Experts
How To Wisely Choose Between Business Intelligence & Business Analytics?
With the advent of Big Data, organizations gather Business Intelligence and Business Analytics for presenting and interpreting data. This enables effective data-driven action plan and provides maximum productivity. Let’s walk through to see what they offer and the goals of each.
Business Intelligence
Business Intelligence is all about accessing and examining your organization’s data. This will help in understanding how successful the business is already, also in making decisions that will help in improving business performance, and in creating new strategic methods for growth.
Business Intelligence performs this by implementing specific metrics to large chunks of unstructured or raw data sets. It also involves querying, data mining, online analytical processing (OLAP), and reporting, in addition to business performance monitoring, predictive and prescriptive analytics strategies.
Business Intelligence works in line with studying or analyzing historical data to the data at present to help understand what has to change for improvement.
Related Reading: Read on to learn more about Business Intelligence.
Business Analytics
Business Analytics is also applied to access and examine your company’s data. But, unlike Business Intelligence strategies, it is more focussed on deriving practical and profitable insights to improve business planning and hike up the business performance.
Business Analytics employs statistical analysis and predictive analytics strategies.
Business Intelligence and Business Analytics – Reporting and Analytics
To monitor how each and every sector in business perform, it is important to have Reporting and Analytics functionalities.
Reporting assembles data and delivers it in a plain and recognizable format. So, reporting stresses on presenting relevant data.
Analytics functionality is a process of data exploration. This delivers meaningful insights. These insights are then used to improve business performance. So, analytics stresses on interpreting the data.
What BI and BA functionalities include in common:
- Both BI and BA collect, analyze and visualize data using data mining, dashboards, and other analytics.
- Provides optimization techniques to organizations to discover the pain points in data for a business.
- Organizes data as reports.
Business Intelligence Versus Business Analytics – Where Do The Similarities End?
To be more specific, Business Intelligence implies ‘what’ will happen to your business in the future and ‘how’. It does so by bringing together the advanced statistical analytics along with predictive analytics to arrive at a forecast of what can be expected in the near future.
Business Analytics, on the other hand, implies ‘why’ factors. This is done to help identify and address an organization’s weak point by analyzing historical and current data. It does so by employing statistical analysis, data mining and quantitative analysis to identify past business trends. In a nutshell, the following are the major differences in their functionality.
BI functionalities include the following:
- Creates a summary of historical data for review. This is called Descriptive Analytics.
- Determines the many concerns raised during descriptive analytics. This is termed Diagnostic Analytics.
BA functionalities include the following:
- Makes predictions based on collected data. This is called Predictive Analytics.
- Offers solutions to issues raised during Descriptive Analytics and during data discovery.
Choosing between BI and BA
- If the need of the hour is to extract insights from the past till present to use them as effective strategies to run your business, you need to choose Business Intelligence and if you need to extract past data to extract insights for your business operations you need to choose Business Analytics.
- Business Intelligence is all about configuring data in the same format to achieve insights, whereas Business Analytics divides the data into different forms and involves studying them to get insights.
- Data is produced in the form of either Dashboards or reports and also as pivot tables, according to the type of users. For instance, analysts use pivot tables, managers use it in the form of reports and dashboards for executives and so on in the case of Business Intelligence, whereas in Business Analytics, past business intelligence information is used for insights.
- Business Intelligence is focussed on Big Data mainly, whereas Business Analytics is focussed on using the latest technologies that handle BigData.
- Business Intelligence offers methods to run the business effectively, whereas Business Analytics is the method of changing the business strategies to make it more productive.
- Business Intelligence is a part of Business Analytics and so business users tend to gain more benefits out of Analytics.
- Business Intelligence is well applied to structured data from ERP applications, say, for example, Financial Software Systems. This gives an insight from the financial transactions that have taken place earlier. This is also used in areas of supply chain and other operations. Business Analytics, on the other hand, is applied to the structure as well as partly as semi-structured data, which is transformed into meaningful insights for the business.
Related Reading: Find how Big Data can add value to your custom software development.
What Works Best For Your Business – BI or BA?
BI can be described as the ‘descriptive’ part of the analytics. Whereas, BA can be seen as BI plus ‘predictive’ elements plus all the other techniques used to interpret data.
BI uses past and current data while BA uses the past and analyzes the present to prepare companies for the future.
Even if BI and BA are well known for saving your business from almost the same set of problems, given raw data on your business, kudos to Business Intelligence rather than Business Analytics, that is, if you want to know how the data at your end can be used and if you want to draw out your own interpretations and arrive at decisions!
So, in a nutshell, BI is connected with ‘what’s’ and ‘how’s’ and BA is more into ‘whys’.
Are you confused about framing your buying decision around Business Intelligence or Business Analytics? Ask yourself the following questions!
- To what extent do you need your business insights to be?
- What functionalities does your system need?
- Who all are using the system?
- How technology-oriented are the people using the system to run queries?
- What amount of visibility is needed over the system as well as the data itself?
- Are your buying decisions based on how and what data requirements for your business are or why has your business been doing how it used to?
BI is specifically intended for non-technical and business users. With Business Intelligence, non-techies find it useful as they can use front-end tools to create their own dashboards and manipulate data using the analytics.
Since business intelligence focuses on situations at the time of tide and business analytics specifies to future situations, combining the two can improve the way an organization reaches current and future business solutions. Watch out for more articles to know how Business Intelligence and Business Analytics can frame your buying decisions to the core!! To learn what suits your business the most, get in touch with our software development experts today!
Stay up to date on what's new
About the Author
Featured Blogs
Stay up to date on
what's new
Talk To Our Experts
What To Watch Out For In 2024 On ERP Market Trends
It’s true that we can never bid adieu to last year’s trend-setting technologies like blockchain, AI, IoT, and multi-cloud. But, neither can we not talk about the progress where technology is likely to echo around the ERP space.
According to a study by MarketWatch, “The ERP software market is expected to rise globally to $47B by 2022”. Let us find out what are the possible market trends in ERP for 2024.
Drastic Rise Of The IoT Market
According to Statista’s latest research, “the global IoT market will rise exponentially from $2.9 trillion in 2014 to over $7 trillion in 2020”. This leads to a situation where ERP systems will need a new level of intelligence and automation to make platforms collect data and insights.
Earlier, only a small percentage of data were created and processed outside a traditional data center. But in the future, there will be a situation where nearly all data will be generated from outside of the data center.
IoT is expected to drive the design and deployment of many operational analytics solutions. Industries such as retail, banking, and telecommunications will also adopt operational analytics to enhance customer experience and quality.
Related Reading: Get answers to where and why should you invest in IoT.
Accelerating Transition To Cloud Computing
According to Statista Reports, “the global market revenue of public cloud services will surpass 278.3 U.S. Dollars in 2021”.
The benefits of this would be greater data security, minimal dependency on hardware, speedy results, and high customer satisfaction. As per the research report by IDC, spending on cloud computing is anticipated to rise at a rate of six times the rate of the current IT spending through which upsurges at 4.5 times the IT spending rate.
Cloud concepts, Content Delivery Network (CDN), DevOps, Big Data and Artificial Intelligence, are going to be the key players in the future of Cloud Computing.
Contribution Of AI And Emerging Disruptive Technologies
The three main trends behind the huge adoption of ERP services are the integration of artificial intelligence (AI), deployment in the cloud, and improved IoT technology.
Big data analytics and the various kinds of AI, including predictive analytics, machine learning, and deep learning, form the catalysts for industries to improve customer experience.
The third wave of technology evolution is based on systems of intelligence (Cloud, IoT, AI, VR, AR). For instance, Chatbots and messaging apps are examples for a rapid expansion in the implementation and adoption of AI.
By implementing advanced solutions such as AI-based chat-bots, IoT sensors and more, businesses will streamline and thereby accelerate their functions. This can tackle productivity issues and also it is an opportunity for businesses to realize the value and utility of new disruptive technologies.
Related Reading: Watch out for the top AI trends
ERP and SaaS – Differences In Overheads
The traditional applications based on ERP were stored on servers. This meant overheads as a result of increased hardware costs as well as costs associated with backup, recovery, and maintenance. The difference between traditional and SaaS applications is that SaaS applications are stored on cloud-based servers.
The benefits of SaaS are that these applications do not demand high maintenance costs, or rather are they expensive. The additional overhead costs that are reduced when it comes to SaaS are that they differ in terms of per-seat licensing costs as well as the total cost of ownership etc.
So, since Saas is a cloud-based model, SaaS-based applications are neither costly, neither are they difficult to maintain.
ERP transition has taken place rapidly. The new SaaS model for ERP is very flexible and useful.
Inclusion Of Social Media Channels
ERP systems in 2024 will need to be able to include direct marketing and data links across multiple social media channels to make their presence felt in the market.
HR managers frequently use social media to search for and hire new employees and also as a background check and even as performance management indicators. These changing trends in business operations are reflected in any competitive ERP platform.
The modules that address are becoming social-media savvy in future. This is mainly due to the high use of customer base that accounts for 2.77 billion customers (according to eMarketer research).
The other engaging trends in ERP adoption are as follows:
-
Focus on Business Intelligence
Organizations are trying to make forecasts with ERP software for business intelligence.
-
Good Integration architecture
An increasing need for ERP software system has resulted in the act of ERP consultants being shifted towards a better integration architecture for ERP software.
-
Two-Tier ERP
Two-tiered ERP is very useful for enterprises since they run in different processes at different places. These tend to match the needs of all locations with a better cost structure. It best suits when the enterprise is large.
-
The Personalization Advantages
Today’s ERP systems are built for personalization. Some systems offer tools to help make it easy and fast in customizing the application to their needs.
-
Large Organizations Acquiring Small Startups
Large organizations try acquiring smaller startups in that regards. This increases ERP implementation.
-
Partnering With Firms That Break The Traditional Rules
With the onset of the cloud, the traditional role of technology partners will no longer be enough. Finding an ERP partner that utilizes the latest technology and analyzing how they deliver service with your needs is required for a successful business.
-
More focus on profit from ERP
As ERP becomes more and more successful in the market, firms blindly implement them now. They are sensitive to the return of investment.
These above trends in ERP to be witnessed in future are beneficial for an organization as well as provide to business growth. ERP software is used in various fields for work and that is the reason why the demand for an ERP software system is increasing every day.
Related Reading: Check out these tips to get your business the best out of your ERP system.
Watch out for more market trends and highlights showcased for future in our latest blogs!!
Also, empower your business with trending technologies. Contact our tech-experts today!
Stay up to date on what's new
About the Author
Featured Blogs
Stay up to date on
what's new
Talk To Our Experts
What is Business Intelligence?
Business Intelligence (BI) turns data into information. It is the sum of applications, technologies, and methods adopted to glean strategically relevant information for the business. The task involves collecting, integrating, analyzing, and applying historical, current and predictive information related to the business. The objective is to gain strategic insights, evaluate risk, and improve decision-making capabilities for top management, business owners, and other stakeholders.
Business intelligence information encompasses both internal data and external data related to the business. Internal data may include operational data, data from sales, financial data, and more. External information is fairly wide in scope and may include information from the external supply chain, social media channels and more. Another dimension to external information for business intelligence is information about competitors and other companies, for benchmarking, and to gain a competitive edge over such companies.
Many businesses now apply business intelligence to make informed decisions, rather than relying on hunches or unfounded assumptions. For instance, restaurant owners use business intelligence to decide the menu to be added and removed from a restaurant menu. Automobile manufacturers apply business intelligence to add new features to their car models. Tour operators use business intelligence to optimize their itinerary. The possibilities are endless. Businesses may use Business intelligence to modify their internal work processes as well.
Business Intelligence Vs. Analytics
One might mistake Business Intelligence as being another name for the much-hackneyed business analytics. While both business intelligence and analytics involve aggregating and analyzing data, the similarity ends there.
Business intelligence aggregates data to make it explicit what is happening to the business, whereas analytics aggregate data to delve into why it happens. For instance, business intelligence evaluates sales performance by extracting data from various sources and presenting it in the form of intuitive graphs. Analytics involves running statistical tests to make explicit whether sales performance correlates with advertisements and promotions undertaken.
While both Business Intelligence and Analytics involve analysis of data, the scope is markedly different. In a sense, Business Intelligence ends with the basic mathematical operations of addition, averages, and percentages to the dataset. Applying advanced algorithms complex formulas, statistical operations such as regression analysis, correlation analysis, and more, to answer deeper questions related to the dataset comes from the realm of analytics.
Technically, Business Intelligence encompasses ETL tools to access and transform data, OLAP (online analytical processing) tools to handle complex queries, tools to manage metadata, development tools to generate various reports and dashboards, and others tools for publishing, scheduling and distribution capabilities. Analytics co-opt different methods of analyzing information, such as descriptive, predictive, regression, neural networks, and the tools to apply such methods.
What is a Business Intelligence Software?
Business intelligence software enables enterprises to undertake business intelligence tasks.
Any Business Intelligence system worth its byte involves the following activities, and software to undertake such activity.
- Data warehousing, or bringing together all data, such as sales data, operational data, data from financial reports, competitor sales data, social media talk, and more. ETL (extract-transform-load) tools usually facilitate the task of extracting data from several databases, systems, and applications, transforming it as required, and loading it into the target data warehouses, analytical applications, and other systems.
- Data visualization, or presenting the information in a visually appealing way, for users to make sense of the data in a better way. There are different visualization types, such as charts, graphs, infographics, and more, and various enabling tools for each type. Each visualization type serves a specific purpose. For example, Pie charts are best suited to communicate relative performance, whereas bar charts depict trends in the best way. Some intuitive methods such as “slice and dice” are gaining popularity of late, for its powerful capabilities.
- Management dashboards, or well-grouped set of visualizations containing most relevant information to any stakeholders, usually reserved for top management. OLAP tools, used to aggregate data and handle complex queries, are commonly associated with Business Intelligence.
Several types of tools enable data visualization and management dashboard capabilities.

- Spreadsheets such as MS-Excel are the most common method of presenting the Business Intelligence data. The ease of work nature and universal availability of spreadsheets are however marred by serious limitations, such as limited security, limited collaboration features, limited automation capabilities, and a high degree of inaccuracy and variability. Various other tools offer seamless and advanced automation, security, and audit capabilities, which MS-Excel lacks.
- Operational reports, often custom made for the enterprise, list data at a very detailed level, in a highly-structured and logical format.
- Querying and analysis solutions allow business users and analysts to generate business queries and reports rapidly. The ad-hoc nature of these tools offers unbridled flexibility. These tools also come with intuitive graphical interfaces. A middleware layer which converts database conventions to normal business nomenclature, and dashboard drag-and-drop functionality spares end-users from the need for technical proficiency to use these tools.
- Dashboard management systems offer easy access to key information in intuitive and graphical formats. It displays the required set of key performance indicators, metrics, and other relevant information in a single consolidated view, greatly improving the user’s decision-making capabilities.
- Data mining tools allow analyzing large data sets to discover patterns and build predictive models. data mining application use algorithms, statistics, advanced mathematical techniques, and sophisticated data search capabilities, to unearth insights otherwise not discoverable.
- Online analytical processing (OLAP) tools facilitate the rapid visualization and analysis of business metrics. Users may store and access data in multidimensional OLAP cubes comprising of measures, and text values. Queries from OLAP cubes are much more powerful than simple database tables and offer users advanced insights into past performance and various “what-if” scenarios. Users may use such cues to evaluate information from various dimensions and perspectives. In fact, OLAP operations constitute the fundamentals of most advanced functionality used by data visualization tools.
Top Business Intelligence Tools 2017

Until a few years ago, users had a limited choice of comprehensive Business Intelligence tools. The choice was limited to platforms offered by biggies, such as IBM, Oracle, SAP or Microsoft. The high cost of the software and the associated complexities made business intelligence out of the reach of most enterprises, except big corporations.
Read more: Business Intelligence in SAP: How It Helps You Become a Data-driven Organization
The advent of the cloud changed things, making business intelligence more democratic. Business no longer needed to build their own BI infrastructure in-house, as SaaS providers perform the resource-intensive tasks of data gathering, persisting and reporting, allowing businesses the ease, affordability, and convenience of the subscription model.
Some of the top ETL tools include Oracle Warehouse Builder, SAP Database Services, IBM Infosphere Information Services, SAS Data Management., Elixir Repertoire for Data ETL, SQL Server Integration Services (SSIS), and more.
Some of the top OLAP tools in vogue include Yellowfin, Stratum, Birst, Profitbase BI, and the quintessential Microsoft SharePoint, among others.
Here is a rundown of some of the leading data visualization and dashboard software in 2017
- Dundas BI, one of the most popular browser-based business intelligence and data visualization platform, offers integrated dashboards, reporting tools, and data analytics capabilities.
- Domo, A cloud-based suite, makes it easy to integrate multiple data sources, including databases, spreadsheets, social media and also legacy cloud-based and on-premise solutions deployed in the enterprise.
- SiSense support business data with powerful visuals and tools, making it handy for users with little or no technical skills.
- BOARD, a centralized tool, hosts data and conducts multidimensional analyses. It boasts an impressive client list, which includes US Navy, Giorgio Armani, and Puma, among others.
- IntelliFront BI enables viewing multiple data sets from a single pane. It also distinguishes itself with strong automation features, real-time dashboards, and on-demand reporting.
Self Service Tools
The emerging trend of self-service business intelligence, made possible by the advancement of mobility, analytics, and other relevant technology, empower end-users with the ability to undertake business intelligence tasks by themselves, without necessarily having advanced technical skills.

As it is with several other sectors, Google has also entered the business intelligence space, and with time, is sure to give established incumbents a run for their money. It is now possible to build an intuitive BI dashboard powered by Google Data Studio reporting tool and Google BigQuery, a cloud-native data warehouse capable of analyzing petabytes of data in double quick time. As always, all these Google tools are open-source and free, giving developers the unbridled freedom to co-opt it in their systems, the way they want it.
Google’s new offering competes with Microsoft Power BI, another free, self-service cloud-based business intelligence offering from the Microsoft staple. Non-technical users may leverage this offering for aggregating, analyzing, visualizing and sharing data easily.
Businesses would do well to consider developing custom suites facilitating such self-service options, integrating ready-to-use Business Intelligence tools to the extent required. Partnering with Fingent top custom software development company would enable the business to roll out highly intuitive business intelligence apps and other solutions, empowering end-users to gain the required insights easy and fast, without having to wait for the IT team to do the job and spoon-feed them with reports.
Stay up to date on what's new
About the Author

Featured Blogs
Stay up to date on
what's new
Talk To Our Experts
According to a recent report by InformationWeek on business intelligence, up to 28% of business professionals responsible for software selection in their firms, said that they have set the standards for one or a few analytics products in their organization. It was 35% last year, so this time apparently we have a 7% decrease.
Now, why has there been such a decrease?
The answer is not very different from what it was for the last three years. Almost 48% of BI decision makers say that “ease-of-use challenges with complex software or less technically savvy employees” is one of the main barriers to its increased adoption. Another major factor being data quality issues.
Although, the survey also found another 21% of decision makers did adopt several analytics and BI products for their firms, which is an increase from 16% from last year.
According to two different schools of thought, there have emerged two different approaches to developing and using analytics software. One school believes that if software, is simple to use, then people can handle even complex analysis. On the other hand, another school believes that if the software is made to be smart, then it can handle the analysis part on its own. So, it all comes down to choosing between simpler or smarter.
Products such as Qlik Sense, Tableau Elastic fall in the “simple to use” category and other popular ones from IBM and SAS fall in the smarter category. Tableau has gone as far as making their software mobile compatible too, adding further to the ease of use. A recent development by IBM is Watson analytics, a cloud-based service that is sure to help in high-end data analysis.
Even though, the choice has to be made between simpler or smarter software, the ultimate fact is that most people prefer software that is both smart as well as easy to use. Our own product ReachOut Engage intends to bridge this gap with an easy to use interface and allows users to analyze the data on a primary level and export data to third-party systems for further analysis. According to the survey, IBM and SAS also argue that their software uses smart features that also make it easy to use. Even then, this idea of smarter versus simpler when put in front of Steve Rimar, senior staff, IT architect at Qualcomm, brought 2 distinct vendors to the limelight. This renowned BI and analytics practitioner said that they have used many tools over the years and QlikView and Oracle OBIEE have proved to be their dominant standards.
When we look into the databases used, the report shows that 26% of decision makers involved in the survey, said that their firms used NoSQL databases, which is an increase from 19% in the last year. Another 22% said that their firms used Hadoop, which again, is an increase from 15% in the last year. Now, Hadoop is one database which is steadily and definitely gaining adoption as a platform for storing high-scale data that is not capable of being stored in other relational databases. Some of the major reasons for this increase in adoption rate include:
- Ability to store and process semi-structured, unstructured and variable data as pointed out by 31% of respondents
- Ability to handle massive volumes of data as pointed out by another 30% of respondents
- Low hardware and storage scaling costs as compared to conventional relational database management systems as pointed out by another 25%
All these facilitate big data analysis. All these also indicate the growing interest in big data analysis. Now, what exactly are the factors that drive this growing interest?
Some of the reasons are:
- The need for finding correlations across multiple data sources like internet clickstreams, geospatial data and customer transaction data as cited by 48% of respondents
- The need for predicting customer behavior as cited by 46%
- The need for predicting product or service sales as cited by 40%
Other major reasons include the need for predicting fraud and financial risks, analyzing social networks and identifying security risks.
On the whole, big data analysis is no longer just data warehousing as we know it at high scale as the report suggests. So, the bottom line is to not just depend on SQL tools alone to learn new things and use new data sources. As other tools are gaining popularity, data analytics and business intelligence and information management are becoming simpler and smarter.
Stay up to date on what's new
About the Author
Featured Blogs
Stay up to date on
what's new


