Tag: big data
We saw great challenges overcome, extraordinary feats accomplished as businesses fought tooth and nail to keep their doors open. It has also been a time of great innovation. While the pandemic reshaped the previously established ways of life and work, the appetite for transformation continued to grow.
Though the last days were a difficult year for businesses, the year’s disruptions led many businesses to adapt to the times and operate with impressive levels of flexibility. It was a year that presented learning, change, and growth opportunities.
As coming years gather momentum, businesses looking to rebound after the pandemic must consider all major technology changes that have happened. Doing so will aid in making decisions that will enable their business to demonstrate fortitude and remarkable ability to adapt as necessary under extraordinary circumstances.
This blog recaps key milestones and moments in the last year that helped businesses break free from survival mode and refocus on a bright and successful future.
The Growing Reach of Digital Transformation
The digital transformation took center stage for businesses as legacy processes and old-school systems could not meet the demands of consumers and employees. Artificial intelligence-driven smart systems helped businesses become more resilient in a locked-down world.
These digital transformations enabled businesses to function efficiently, employees to increase productivity, and empowered customers to shop from the comfort of their homes. Towards the end of the year, these new technologies and tools continued to mature and to create a future where people are shaping the world to fit their needs and preferences.
Workforce Technologies Increased Employee Productivity
In the pre-pandemic era, working from home was not considered as productive as working in the office. However, a two-year study by Great Place to Work determined that employee productivity was the same or even better when they worked from home.
Read more: Fingent Recognized as a Great Place to Work-Certified™ Company

As the workforce technologies got better, faster, and more powerful, there was an exponential rise in the hybrid workplace concept. These technologies allowed businesses to retain the culture, stability, and social interaction of a physical office as they allowed their employees to choose remote work.
The AI-powered HR technology empowers employers and employees to customize goals, roles, and structures. These powerful technologies help hybrid teams to stay connected to live, interactive systems even if they all work in different time zones.
Case Study: Learn more on how Fingent’s AI-Powered Virtual Assistant helps employees with HR & DevOps queries
Enhanced Omnichannel Experience
Providing a fluid omnichannel experience is critical to satisfying customers and building customer loyalty. An omnichannel experience enabled customers to interchange devices and move fluidly between various platforms. It created a truly seamless and consistent experience regardless of channel.
It allowed customers to start their search in one channel, pick it from where they had left on another device, and yet take the context forward with every interaction. Businesses ensured to develop their omnichannel strategy by unifying the digital and physical world.
The adoption of omnichannel enhanced retailers’ experiences as well. For instance, a customer may reach out on live chat with an issue and end the call only to realize later that he forgot to ask one more thing. Now, he may call customer service instead of using a live chat. Omnichannel experience will allow the agent to pull up that customers’ previous chat and have all of the contexts to quickly resolve his issues.
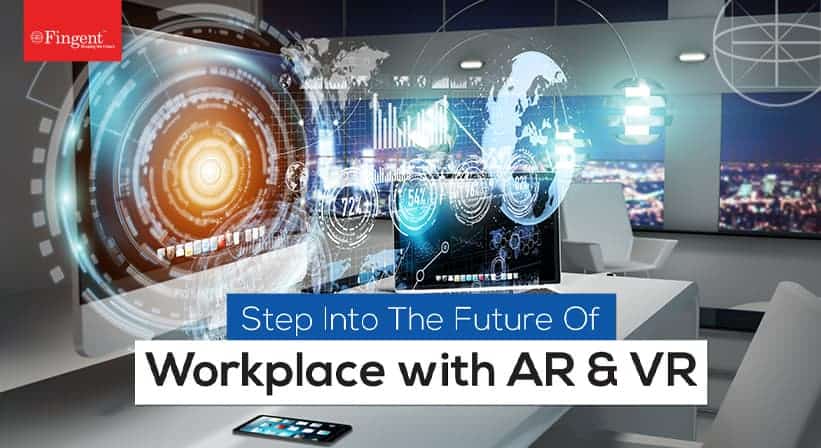
Personalization and Hyper-personalization with AR and VR Technologies
Personalization and hyper-personalization are the most advanced ways to increase revenue, smoothen customer journeys, and make conversations more meaningful. Personalization can be achieved only through careful analysis of customer data.
In the last year, businesses saw how retail analytics tools can provide actionable insights into customers buying patterns and preferences. This will help in customizing the offering. Virtual try-on, AR in retail enable immersive shopping experiences. Moreover, high-value customers can be catered to exclusively and attract the right customer to increase sales.
Read more: Creating a Future workplace with AR & VR!
Blockchain Took Center Stage
Blockchain interoperability will get better in the coming years. It has been used to transform the nature of transactions and trade across the world. Blockchain technology made cryptocurrency a possibility. It is instrumental in lowering transaction costs, providing protection from cyber-attacks, helping maintain confidentiality, and more.
Another popular blockchain trend was BaaS or Blockchain as a Service. It is a cloud-based service that enables users to develop digital products like smart contracts or applications that can work without any setup requirement of a complete blockchain-based infrastructure.
Read more: How Blockchain Enables The Insurance Industry to Tackle Data Challenges
Real-time Visibility into Inventory and Services
To meet customer expectations, it is crucial to have the ability to view and track inventory levels at all times. Real-time visibility enables businesses to prepare for the unexpected. It also provides data and analytics needed to made better business decisions.
So, appropriate tools that leveraged AI and ML brought about improvement in maintaining accurate stock and preparing for future demand. These tools provided end-to-end visibility across the supply chain and helped businesses meet the growing customer demand.
Read more: How Data Warehousing Adds Value to Data Visualization and Reporting
NFT Gains Traction and Expand into New Areas
NFT (Non-Fungible Token) is drawing in new artists, musicians, and other creative people who want to make money. NFT bunny is modeled after social networks with each user having the ability to communicate with other users. Binance NFT allows an artist to buy or sell collectibles and other artworks.
Demand Forecast with The Help Of AI, Big Data, And Analytics
Data-driven business transformation gained popularity among retailers as it provided a strategic advantage. AI, Big Data, and Analytics help in understanding the deep patterns of the data from various sources used for demand forecasting. Retailers have immensely benefited from hourly, daily, weekly, and monthly level forecasts.
Resilient Supply Chains
The strategic application of AI-powered technologies has enabled complex and resilient supply chains. This has improved same-day delivery options. This year also saw the expansion of e-bikes managed by user-friendly apps and cloud-connected supply chain technologies.
Rising From the Ashes with Smarter Business Technologies
Lat few years have been challenging year for most businesses. Amid pandemic and political upheavals, we saw exciting advances and breakthroughs in businesses technology. Also, customers are more value-conscious today than before. These technologies help reduce business operations costs and pass on the benefit to the customers. Leveraging these technologies is a smart way to build a resilient business. Excited to know which technology is best for your business? Call us and let’s work it out together.
Stay up to date on what's new

About the Author

Featured Blogs


Stay up to date on
what's new


Talk To Our Experts
Undoubtedly, data is what we see almost everywhere, and it is enormous. And it doesn’t stop there, it is growing continuously at a level beyond imagination! Let’s have a look at how it has changed over the years.
A look into how Data and AI transformed in years!
In the 1950s, when there were fewer technological developments, companies would collect the data(offline) and analyze it manually. This was also backed by limited data sources that made it time-consuming in obtaining the results.
The mid-2000s paved the way for changing the world for the better and it was during this time the term “big data” was coined. Almost every business that had something to do with digital infrastructure started looking for ways to use the large data and come up with meaningful insights.
This era also saw the invention of tools like Data mining, OLAP, etc., taking technological advancements to the next level. In general, the internet gained immense popularity not only for organizations but also for households. During this time, technology became more advanced and provided automated options for managing data, and data analysts could analyze data, trends, etc., and provide better recommendations.
Google, Amazon, Paypal, and others also made a mark causing the volume of data to reach newer heights. However, all this posed a storage and processing problem.
The late 2000s to early 2010s saw a surge in Facebook, Twitter, Smartphones, and connected devices. The companies used improved search algorithms, recommendations, and suggestions driven by the analytics rooted in the data to attract their customers. Enterprises also realized that would have to deal with unstructured data and so they got familiar with databases such as NoSQL. New Technologies were introduced for faster data processing and machine learning models were used for advanced analytics.
Now, businesses are a step ahead and using automated tools using cloud and big data technologies. With cloud platforms, it is now easier to enable massive streaming and complex analytics.
Read more: 5 ways in which big data can add value to your custom software development
Having seen how data has evolved over the years, let’s have a look at how Artificial Intelligence has transformed in the last generation.
In 1950, a British mathematician and WWII code-breaker- Alan Turing was one of the first people to come up with the idea of machines that could think. To date, the Turing Test is used as a benchmark to determine a machine’s ability to think like a human. While this notion was ridiculed at the time, the term artificial intelligence gained popularity in the mid-1950s, after Turing’s death.
Later, Marvin Minsky, an American cognitive scientist picked up the AI torch and co-founded the Massachusetts Institute of Technology’s AI laboratory in 1959. He was one of the leading thinkers in the AI field through the 1960s and 1970s. It was the rise of personal computers in the 1980s that sparked interest in machines that think.
That said, it took several decades for people to recognize the true power of AI. Today, Investors and physicists like Elon Musk and Stephen Hawking are continuing the conversation about the potential for AI technology in combination with big data could have and how it could change human history.
AI technology’s promising feature is its ability to continually learn from the data it collects. The more the data it collects and analyses through specially designed algorithms, the better the machine becomes at making predictions.
Impact on business
AI and big data have an impact on businesses like never before. Whether it is workflow management tools, trend predictions, or even advertising, AI has changed the way we do business. Recently, a Japanese venture capital firm became the first company ever to nominate an AI board member for its ability to predict market trends faster than humans.
On the other hand, data has been the primary driver for AI advancements. Machine learning technologies can collect and organize a large amount of data to make predictions and insights that otherwise cannot be achieved with manual processing. This not only increases organizational efficiency but reduces the chances of any critical mistake. AI can detect spam filtering or payment fraud and alert you in real-time about malicious activities.
AI machines can be trained to handle incoming customer support calls thereby reducing costs. Additionally, you can use these machines to optimize the sales funnel by scanning the database and searching the Web for prospects that have similar buying patterns as your current customers.
Read more: The Future of Artificial Intelligence – A Game Changer for Industries
5 trends in data and artificial intelligence that can help data leaders.
1. Customer experience will be the key
Supply chain and operating costs will mean nothing if you are unable to hold on to your customers. Today, businesses have to be more connected with their customers to be on top of the game. From in-person and digital sales to call centers, companies will have to collect data to have a holistic view of the customer. Businesses must consider other forms of interaction such as using voice analytics to understand how customers interact with call centers or chatbots.
2. Leveraging External data
External data can provide early warning signs about what’s going on. To make external data work, companies must start with a business problem and then think about the possible data that could be used to solve it. That said, companies might need to modernize data flows to leverage external data.
While many businesses have started leveraging external data, some companies haven’t leveraged it yet as they are either too focused on internal data or finding it difficult to transfer data.
A prime example of brands that used external data is Hershey’s Chocolates. It leveraged external data to predict an increase in the number of people using chocolate bars for Backyard S’mores and a decline in sales for smaller candy bars for trick-or-treating.
3. CDOs leading the way towards a data-driven culture
Introducing any new technology without training your employees to adapt and figure out new skills and processes will not be effective. According to Cindi Howson, chief data strategy officer at analytics platform provider ThoughtSpot, Chief Data Officers (CDOs) need to take the lead and empower their employees and the organization to gain time and efficiency with data. Also, CDOs will have to make sure to upskill employees to take full advantage of new technology.
4. Multi-Modal learning
With advances in technology, AI can support multiple modalities such as text, vision, speech, and IoT sensor data. All this is helping developers find innovative ways to combine modalities to improve common tasks such as document understanding.
For example, the data collected and processed by healthcare systems can include visual lab results, genetic sequencing reports, clinical trial forms, and other scanned documents. This presentation, if done right, can help doctors identify what they are looking at. AI algorithms that leverage multi-modal techniques (machine vision and optical character recognition) could augment the presentation of results and help improve medical diagnosis.
5. AI-enabled employee experience
Business leaders are starting to address concerns about the ability of AI to dehumanize jobs. This is driving interest in using AI to improve the employee experience.
AI could be useful in departments such as sales and customer care teams that are struggling to hire people. Along with robotic process automation, AI could help automate mundane tasks to free up the sales team for having a better conversation with customers. Additionally, it could be used to enhance employee training.
Read more: 9 Examples of Artificial Intelligence Transforming Business Today
Conclusion
Leveraging data and Artificial intelligence has grown due to the pandemic and businesses are digitally connected than before the lockdown.
At Fingent, we equip business leaders with insights, advice, and tools to achieve their business goals and build a future-proof organization. To learn more about how we fuel decision-makers to build successful organizations of tomorrow, contact us.
Stay up to date on what's new
About the Author

Featured Blogs
Stay up to date on
what's new
Talk To Our Experts
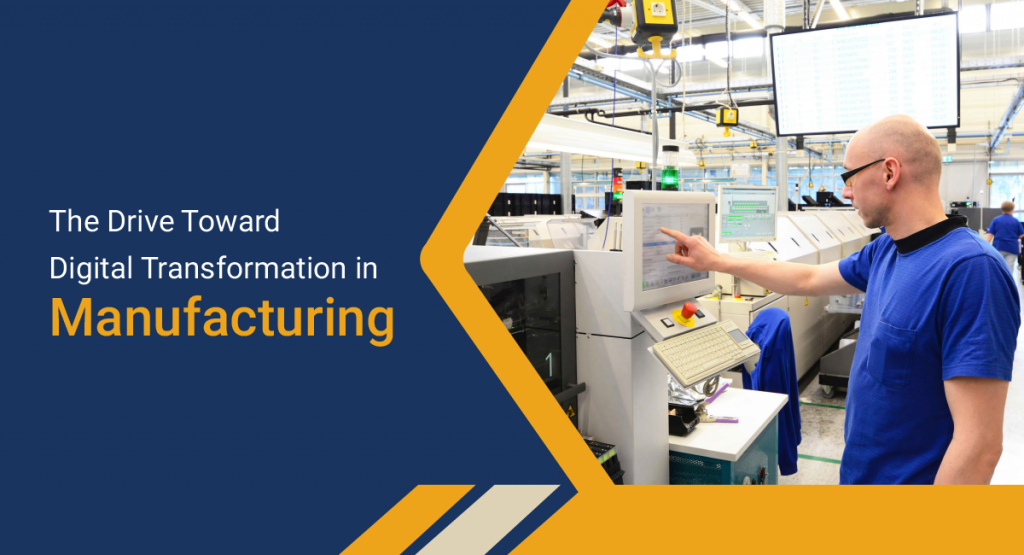
Manufacturing technologies set to hold the reins
From big data analytics to advanced robotics to computer vision in warehouses, manufacturing technologies bring unprecedented transformation. Many manufacturers are already leveraging sophisticated technologies for manufacturing such as the internet of things(IoT), 3D printing, Artificial Intelligence, etc., to improve operations’ speed, reduce human intervention, and minimize errors.
As 2024 rapidly approaches, manufacturers will have to move away from Industry 4.0 and embrace Industry 5.0. The latter is all about connecting humans and machines (smart systems). Interestingly, Industry 5.0 may already be here. The ongoing COVID-19 pandemic only accelerates its arrival.
Read more: Digital Transformation in Manufacturing
Here are the top 10 technologies that positively impact the manufacturing industry.
1. Robotics
With advances in robotics technology, robots are more likely to become cheaper, smarter, and more efficient. Robots can be used for numerous manufacturing roles and can help automate repetitive tasks, enhance accuracy, reduce errors, and help manufacturers focus on more productive areas.
Benefits of Using Robotics in Manufacturing:
- They improve efficiency right from handling raw material to finished product packing
- You can program robots to work 24/7, which is excellent for continuous production
- Robots and their equipment are highly flexible and can be customized to perform complex jobs
- They are highly cost-effective even for small manufacturing units
Collaborative assembly, painting, and sealing, inspection, welding, drilling, and fastening are a few examples of the jobs done by robots. Today, robots work in several industries, including rubber and plastic processing, semiconductor manufacturing, and research. While they are mainly used in high-volume production, robots make their presence felt in small to medium-sized organizations.
Read more: What Are Cobots and How Can They Benefit Industries?
2. Nanotechnology
Nanotechnology has grown to a great extent in the last few years. It involves the manipulation of nanoscopic materials and technology. Though its widespread use is relatively new, it will be indispensable to every manufacturing industry soon. Further research and experimental designs suggest that nanotechnology can be highly effective in the manufacturing industry.
Applications of Nanotechnology in Manufacturing:
- Create stable and effective lubricants that are useful in many industrial applications
- Car manufacturing
- Tire manufacturers are using polymer nanocomposites in high-end tires to improve their durability and make them wear resistance
- Nanomachines, though not used widely in manufacturing now, are, for the most part, future-tech
3. 3D Printing
Post its tremendous success in the product design field, 3D printing is set to take the manufacturing world by storm. The 3D printing industry was worth USD 13.7 billion in 2019 and is projected to reach USD 63.46 billion by 2025. Also known as additive manufacturing, 3D Printing is a production technology that is innovative, faster, and agile.
Benefits of Using 3D Printing in Manufacturing:
- Reduces design to production times significantly
- Offers greater flexibility in production
- Reduces manufacturing lead times drastically
- Simplifies production of individual and small-lot products from machine parts to prototypes
- Minimizes waste
- Highly cost-effective
Major car manufacturers use 3D printing to produce gear sticks and safety gloves.
Read more: 3D Printing: Fueling the Next Industrial Revolution
4. The Internet of Things (IoT)
IoT in manufacturing employs a network of sensors to collect essential production data and turn it into valuable insights that throw light into manufacturing operational efficiency using cloud software. This connectivity had brought machines and humans closer together than ever before and led to better communication, faster response times, and greater efficiency.
Benefits of Using IoT in Manufacturing
- Internet of Things (IoT) reduces operational costs and creates new sources of revenue
- Faster and more efficient manufacturing and supply chain operations ensure a shorter time-to-market. For instance, Harley- Davidson leveraged IoT in its manufacturing facility and managed to reduce the time taken to produce a motorbike from 21 hours to six hours.
- IoT facilitates mass customization by providing real-time data essential for forecasting, shop floor scheduling, and routing.
- When paired with wearable devices, IoT allows monitoring workers’ health and risky activities and making workplaces safer.
The ongoing pandemic has expanded the focus on IoT due to its predictive maintenance and remote monitoring capabilities. Social distancing makes it difficult for field service technicians to show up on short notices. IoT-enabled devices allow manufacturers to monitor equipment’s performance from a distance and identify any potential risks even before a malfunction occurs. Additionally, IoT has enabled technicians to understand a problem at hand and come up with solutions even before arriving at the job site so that they can get in and get out faster.
Read more: Upcoming IoT trends that can shape the business landscape
5. Cloud Computing
After making its presence felt in other industries, cloud computing is now causing ripples in manufacturing. From how a plant operates, integrating to supply chains, designing and making products to how your customers use the products, cloud computing is transforming virtually every facet of manufacturing. It is helping manufacturers reduce costs, innovate, and increase competitiveness.
IoT helps improve connectivity within a single plant, while cloud computing improves connectivity across various plants. It allows organizations across the globe to share data within seconds and reduce both costs and production times. The shared data also helps improve the product quality and reliability between plants.
Read more: Why It’s Time to Embrace Cloud and Mobility Trends To Recession-Proof Your Business?
6. Big Data
The manufacturing industry is complicated in terms of the variety and depth of the product. As far as opening new factories in new locations and transferring production to other countries is concerned, companies can leverage big data to tackle it.
As the process of capturing and storing data is changing, new standards in sharing, updating, transferring, searching, querying, visualizing, and information privacy are arising. Think of manufacturing software like MES, ERP, CMMS, manufacturing analytics, etc. When integrated with big data, these can help find patterns and solve any problems.
Benefits of Using Big Data:
- Improve manufacturing
- Ensure better quality assurance
- Customize product design
- Manage supply chain
- Identify any potential risk
Explore our use case: Adding New Dimensions to Equipment Maintenance with IIoT, AR, and Big Data

7. Augmented Reality
In manufacturing, we can use AR to identify unsafe working conditions, measure various changes, and even envision a finished product. Augmented Reality can help a worker view a piece of equipment and see its running temperature, revealing that it is hot and unsafe to touch with bare hands. An employee can know what’s happening around them, like what machinery is breaking down, a co-worker’s location, or even a factory’s restricted sites. Simply put, AR applications can help inexperienced employees to be informed, trained, and protected at all times without wasting significant resources.
AR has made it possible for technicians to provide remote assistance by sending customers AR and VR enabled devices and helping them with basic troubleshooting and repairs during the COVID-19 crisis. Also, more and more customers are open to allowing manufacturers to implement AR with the long-term goal of creating permanent solutions. After all, it helps both the customers and field technicians by reducing the risk of exposure.
Read more: How Augmented Reality Can Simplify Equipment Maintenance
8. 5G
5G will have a tremendous impact on the manufacturing industry. It will be more transformational for devices that drive automated industrial processes.
The amazing low-latency and connectivity of 5G will power sensors on industrial machines. It will help generate a lot of data that will open new avenues of cost savings and efficiency when combined with machine learning. Currently, China and South Korea are leveraging 5G this way. Soon the US and the UK are expected to compete with them.
Read more: From Remote Work to Virtual Work, 5G is Reinventing the Way We Work
9. Artificial Intelligence(AI)
Manufacturers are already employing automation on the plant floor and in the front office. In the future, AI-powered demand planning and forecasting will continue to develop that will help manufacturers align their supply chain with demand projections to get data that were not possible previously.
A study from IFS shows that 40% of manufacturers plan to implement AI for inventory planning and logistics and 36% for production scheduling and customer relationship management. 60% of the respondents are said to focus on productivity improvements with these investments.
Read more: The Future of Artificial Intelligence – A Game Changer for Industries
10. Cybersecurity
Moving manufacturing operations to the cloud and building and integrating systems using IoT will equally create opportunities and challenges. In an increasingly insecure digital era, there is a pressing need for heightened security.
Manufacturing experts are investing in secure cloud-based ERP like SAP and Odoo to resolve the security challenges. Enterprises-big or small- will soon increase their dependence on cloud-based ERP systems to address security glitches and save costs by paying for usage.
Read more: Top 6 Reasons Why You Should Move to a Cloud-Hosted ERP
White Paper: What difference does RPA bring to your business? How can you embrace this disruptive technology to remain competitive? Download to learn more!
Conclusion
Technologies for manufacturing will decrease labor costs, improve efficiency, and reduce waste, making future factories cheaper and more environment-friendly. Additionally, improved quality control will ensure superior products that will benefit both the consumers and the manufacturers.
COVID-19 has changed the way the manufacturing industry operates. If your business wants to remain competitive, you will have to embrace manufacturing technologies to shape your company’s future. To know more about the forward-thinking strategies that integrate the latest trends and technologies, please connect with us today.
Stay up to date on what's new
About the Author
Featured Blogs
Stay up to date on
what's new
Talk To Our Experts
Data Lake vs Data Warehouse
A data lake is a location where new data can enter without any hurdles. Since any kind of data can reside in a data lake, it is a great source to unearth new ideas and experiment with data. However, due to this openness, it suffers from a lack of meaningful structure. The larger business audience may find that the data lake is a mess. This is where the scalability traits of the data warehouse gain significance. In data warehousing, we try to match dimensions and measures into queryable components that are consistent. This makes it easier for an ever-scalable audience to consume this data.
Let us now take a deep dive and compare the properties of a data lake and a data warehouse.
Read more: How Data Warehousing Adds Value To Data Visualization & Reporting
7 key differences between data lake and data warehouse
1. Type of Operation:
- A data warehouse is used for Online Analytical Processing (OLAP). This includes running reports, aggregating queries, performing analysis, and creating models such as the OLAP model based on whatever you want to do. These operations are carried out typically after your transactions are done. For example, you want to check all the transactions done by a particular client. Since the data is stored in a denormalized format, you can easily fetch the data from a single table and showcase the required report.
- A data lake is used typically to perform raw data analysis. All the raw data i.e XML files, images, pdf, etc. are just gathered for further analysis. While capturing data, you don’t have to define the schema. You may not know how this data can be used in the future. You are free to perform different types of analytics to uncover valuable insights.
2. Cost of storing data:
- In data warehouses, the cost of data storage is high. This is because the software used by these data warehouses are expensive. Additionally, the cost of maintenance is also high since it consists of power, cooling, space, and telecommunications. Another point to consider is that since a data warehouse contains large amounts of data in a denormalized format, it tends to take up a lot of disk space.
- Contrarily, in data lakes the cost of data storage is low. They use open-source software which costs less. Also since the data is unstructured, data lakes can scale to high volumes of data at low cost.
3. Schema:
- Data warehouses use schema-on-write. Before storing the data, it has to be transformed and provided for application in analytics and reporting. You need to know for what purpose you’ll be using the data prior to importing it into the data warehouse. As new requirements arise, you may have to reevaluate the models that were defined earlier.
- On the other hand, data lakes employ schema-on-read. Without the necessity of a single schema, users can store any kind of data in the data lake. They can discover the schema later while reading the data. This means different teams can store their data in the same place without relying on the IT departments to write ETL jobs and query the data.
4. Data Quality:
- A data warehouse contains high-quality data. As the data undergoes extreme curation before storage, it can be considered as the central version of the truth.
- A data lake contains raw data that may or may not be curated.
Read more: Data Visualization vs. Data Analytics – What’s the Difference?
5. Users:
- Typically business professionals who deal with reporting use data warehouses. Again, since the operation costs of a data warehouse tend to be higher, large and established organizations that deal with tons of data opt for it.
- Data scientists and analysts generally use data lakes. With raw data the possibilities are endless. They can perform various types of analytics to glean insights and identify patterns to convert the data at hand into valuable information.
6. Security:
- Data warehouses tend to store extremely sensitive data for reporting purposes. These could be compensation data, credit card information, healthcare data, and so on. The data security for data warehouses is mature and robust since this technology has been around for quite a while now. Only authorized personnel can access the data warehouse.
- Data Lake is a relatively new technology and hence data security is still evolving. As mentioned, a data lake is created using open source technologies. Therefore its data security is not as great as that of a data warehouse.
7. Technology:
- Data warehouse applications use relational database technologies. This is because relational database technologies support quick queries against structured data.
- The Hadoop ecosystem is well-aligned to the data lake approach because of its agility. It can easily scale to large volumes and can handle any structure of data.
Read more: Power BI or Tableau: Which is the better choice for your business
How both data lake and data warehouse can go hand in hand
Both data lake and data warehouse are the principal constituents of modern data architecture. A data lake usually serves as the starting point from where organization-wide data is onboarded. It is also the stage at which the data warehouse structures its data. An organization that incorporates both data lake and data warehouse will exhibit the traits of entrepreneurship and diligence, which means the organization will be both open-minded and scalable.
The BI industry has tools that cater to highly unstructured data lakes that enable open-minded discovery. Also, there are tools that are designed to scale as a structured information delivery platform concurrently with your data warehouse. Though these tools oppose one another, they have very little in common. They are purpose-built according to the needs of an organization. So before choosing a tool you need to determine which one would be right for your needs and help your organization grow. Contact us now for more information!
Stay up to date on what's new
About the Author
Featured Blogs
Stay up to date on
what's new
Talk To Our Experts
What is Exploratory Data Analysis?
Exploratory Data Analysis (EDA) is a statistical approach used to analyze data and produce descriptive and graphical summaries. Analysts may or may not use a statistical model, but EDA primarily foresees what the data can reveal to us beyond formal modeling.
With EDA you can analyze your data as it is, without the need to make any assumptions. EDA further validates and expands the practice of using graphical methods to explore data. EDA gains insights from statistical theories that give easily decipherable insights. Exploratory data analysis techniques can also be used to derive clues from data sets that are unsuitable for formal statistical analysis.
Exploratory Data Analysis displays data in such a way that puts your pattern recognizing capabilities to full use. The patterns are evident to an examination that is careful, direct, and most importantly assumption-free. Thus, you can understand relationships among variables, identify problems such as data entry errors, detect the basic data structure, test assumptions, and gain new insights.
Purpose of Exploratory Data Analysis
The prime purpose of EDA is to study a dataset without making any assumptions. This helps the data analyst to authenticate any assumptions made in devising the problem or operating a particular algorithm. Researchers and analysts can, therefore, recommend new schemes that were not previously considered.
In other words, you apply inductive reasoning to obtain results. These results may be in opposition to the theories that directed the initial data collection process. Thus, EDA becomes the driver of transformation. This approach allows you to oppose planned analyses and probe assumptions. The ensuing formal analysis can continue with better credibility. EDA techniques have the potential to uncover further information that may open new areas for research.
Role of EDA in Data Science
We need to understand the role of EDA in the whole process of data science. Once you have all the data, it has to be processed and cleaned before performing EDA. However, after EDA, we may have to repeat the processing and cleaning of data. The cleaned data and results obtained from this iteration are further used for reporting. Thus, using EDA, data scientists can rest assured that the future results would be logical, rightly explained, and relevant to the expected business circumstances.
EDA helps to clean the feature variables that are to be used for machine learning. Once data scientists get familiarized with the data sets, they may have to go back to feature engineering since the early features may be unable to serve the objective anymore. After completion of the EDA, data scientists obtain a feature set that is required for machine learning. Each dataset is generally explored using multiple techniques.
Read More: Top 10 Must-Know Machine Learning Algorithms in 2020
Methods of Exploratory Data Analysis
Exploratory data analysis is carried out using methods like:
- Univariate Visualization – This is a simple type of analysis where the data analyzed consists of a single variable. Univariate analysis is mainly used to report the data and trace patterns.
- Bivariate visualization – This type of analysis is used to determine the relationships between two variables and the significance of these relationships.
- Multivariate visualization – When the data sets are more complex, multivariate analysis is used to trace relationships between different fields. It reduces Type I errors. It is, however, unsuitable for small data sets.
- Dimensionality Reduction – This analysis helps to deduce which parameters contribute to the maximum variation in results and enables fast processing by reducing the volume of data.
Using these methods, a data scientist can grasp the problem at hand and select appropriate models to corroborate the generated data. After studying the distribution of the data, you can check if there’s and missing data and find ways to cope with it.
Then comes the outliers. What are your outliers and how are they affecting your model?
It’s always better to take small steps at a time. So you need to check if you can remove some features and still get the same results. More often than not, companies just venturing into the world of data science and machine learning find that they have a lot of data. But they have no clue how to use that data to generate business value. EDA techniques empower you to ask the right questions. Only specific and defined questions can lead you to the right answers.
Exploratory Data Analysis: Example with Python
Read More: Why you should migrate to Python 3
Suppose you have to find the sales trend for an online retailer.
Your data set consists of features like customer ID, invoice number, stock code, description, quantity, unit price, country, and so on. Before starting, you can do your data preprocessing, that is, checking the outliers, missing values, etc.
At this point, you can add new features. Suppose you want the total amount. You multiply quantity and unit price to get this feature. Depending on the business requirement, you can choose which features to add. Moving on, by grouping the countries and quantity or total amount together, you can find out which countries have maximum and minimum sales. Using Matplotlib, seaborn, or pandas data frame you can visually display this data. Next, by grouping the year and total amount, you can find out the sales trend for the given number of years. You can also do the same for each month and find you out which time of the year has shown a spike or drop in sales. Using this same method, you can identify further problems and find out ways to fix them.
Read More: How to Use Data Analytics to Improve Enterprise Sales Numbers
The key to exploratory data analysis is to first understand the LOB and get a good hang of the data to get the desired answers. Get in touch with us to know more about EDA.
Stay up to date on what's new
About the Author

Featured Blogs
Stay up to date on
what's new
Talk To Our Experts
Data Mining Vs Predictive Analytics: Learn The Difference & Benefits
With big data becoming the lifeblood of organizations and businesses, data mining and predictive analytics have gained wider recognition. Both are different ways of extracting useful information from the massive stores of data collected every day. Often thought to be synonyms, data mining and predictive analytics are two distinct analytics methodologies with their own unique benefits.
This blog examines the differences between data mining and predictive analytics.
Difference Between Data Mining and Predictive Analytics
Data mining and predictive analytics differ from each other in several aspects, as mentioned below:
Definition
Data mining is a technical process by which consistent patterns are identified, explored, sorted, and organized. It can be compared to organizing or arranging a large store in such a way that a sales executive can easily find a product in no time. Various reports state that by 2020 the world is poised to witness a data explosion. Therefore, data mining is a strategic practice that is necessary for successful businesses. It helps marketers create new opportunities with the potential for rich dividends for their businesses.
Predictive analytics is the process by which information is extracted from existing data sets for determining patterns and predicting the forthcoming trends or outcomes. It uses data, statistical algorithms, and machine learning techniques to identify the likelihood of future outcomes based on historical data. In other words, the aim of predictive analytics is to forecast what will happen based on what has happened.
Techniques and Tools
Although there are many techniques in vogue, data mining uses four major techniques to mine data. They are regression, association rule discovery, classification, and clustering. These techniques require the use of appropriate tools that have features like data cleansing, clustering, and filtering. Python and R are the two commonly used programming languages in data mining.
Unlike data analytics, which uses statistics, predictive analytics uses business knowledge to predict future business outcomes or market trends. Predictive analytics uses various software technologies such as Artificial Intelligence and Machine Learning to analyze the available data and forecast the outcomes.
Purpose
Data mining is used to provide two primary advantages: to give businesses the predictive power to estimate the unknown or future values and to provide businesses the descriptive power by finding interesting patterns in the data.
Predictive analytics are used to collect and predict future results and trends. Although it will not tell businesses what will happen in the future, it helps them get to know their individual consumers and understand the trends they follow. This, in turn, helps marketers take necessary, action at the right time, which in turn has a bearing on the future.
Related Reading: Predictive Analytics: The Key to Effective Marketing and Personalization
Functionality
Data mining can be broken down into three steps. Exploration, wherein the data is prepared by collecting and cleaning the data. Model Building or Pattern Identification by which the same dataset is applied to different models, thus enabling the businesses to make the best choice. Finally, Deployment is a step where the selected data model is applied to predict results.
Predictive analytics focuses on the online behavior of a customer. It uses various models for training. With the use of sample data, the model could be trained to analyze the latest dataset and gauge its behavior. That knowledge could be further used to predict the behavior of the customer.
Talent
Data mining is generally executed by engineers with a strong mathematical background, statisticians, and machine learning experts.
Predictive analytics is largely used by business analysts and other domain experts who are capable of analyzing and interpreting patterns that are discovered by the machines.
Outcome
Data mining enables marketers to understand the data. As a result, they are able to understand customer segments, purchase patterns, behavior analytics and so on.
Predictive analytics helps a business to determine and predict their customers’ next move. It also helps in predicting customer churn rate and the stock required of a certain product. Additionally, predictive analytics enable marketers to offer hyper-personalized deals by estimating how many new subscriptions they would gain as a result of a certain discount, or what kind of products do their customers seek as a complement to the main product they bought from the seller.
Related Reading: Using Predictive Analytics For Individualization in Retail
Effect of Data Mining and Predictive Analytics on the Future
The global predictive analytics market is estimated to reach 10.95 billion by 2022. We are now in a period of constant growth, where businesses have already started using data mining and predictive analytics sift through the available data for searching patterns, making predictions and implementing decisions that will impact their business.
Both approaches enable marketers to make informed decisions by increasing productivity, reducing costs, saving resources, detecting frauds, and yielding faster results. To make the best use of data mining and predictive analytics, you need the right guidance and the best expertise. Talk to our experts and find out how Fingent, top custom software development company can help your business scale up with the power of data. Get on your way to a digital-first future with us.
Stay up to date on what's new
About the Author

Featured Blogs
Stay up to date on
what's new
Talk To Our Experts
Impact Of Data Visualization On Future Technologies
Data Visualization is no more art. With emerging cognitive frameworks, multidimensional imaging and intelligence; data visualization is opening new horizons in being able to visualize large chunks of complex data. Being the modern substitute for visual communication, Data Visualization has enabled easy decision making for businesses.
Data Visualization Impacts
Data VIsualization helps data to be understood in visually interactive forms such as patterns, correlations, graphics and so on. It delivers a better understanding of the business states and in developing patterns that provide solutions and insights. The impacts of Data Visualization are as follows:
- Display of critical data in visually interactive forms.
- Can display trends over any period of time.
- Can grasp large chunks of complex data in an easy visual form.
- Prevents chances of errors in decision-making.
- Helps in identifying key features that impact business results.
- Helps in developing a forecast for future steps to be taken.
Data Visualization – Why is it Important For Your Business and How?
It is a fact that 90 percent of the information transmitted to the brain is visual, and high-quality infographics are thirty percent more preferred than plain text. This figure implies how Data Visualization can be used to help your business achieve heights in today’s data-driven sphere!
Data Visualization benefits are as follows:
- Data visualization can cut short business meetings by 24%, reports American Management Association statistics.
- A report by Tableau, reveals that managers who use the tools for visual data recovery find the correct required data, whereas, 48 percent more than the others need help from their IT staff and other personnel.
- The advanced analytics capability of Data Visualization tools makes it 5 times easier in decision-making processes than their competitors.
- Specific business intelligence that has effective data visualization techniques, provide an ROI of $13.01 for each dollar spent, states report based on Nuclear Research.
Related Reading: Find what you need to ask and learn, before choosing your data visualization tool.
How Is Data Visualization Crucial For Big Data?
Data Visualization affects the approach of analysts who work with data. Getting more insights and being able to respond to issues more quickly are two among the numerous key advantages of Data Visualization. In addition to these, real-time support to customers and monetization of Big Data in Retail Banking are also made possible.
Data Visualization in the form of infographics and other visual tools allows businesses to run smoothly and also speeds up analysis processes. This is because, when in visual form, it becomes easier to view data rather than viewing on spreadsheets.
The future of data visualization with Big Data maximizes the potential and increases productivity by providing infographics that can be transformed into critical insights.
The Future Of Data Visualization
- Data On-Demand
There are 28 zerrabytes (a trillion gigabytes) of data that is being created every year. This figure shows how much data is readily available for anything and certainly everything under the sun. The devices that are interconnected with these multiple streams of data undoubtedly improves efficiency and is also intensely accurate.
- Data Storing Into Database With a Clear Purpose
The large chunks of data collected entirely need not be stored in the database. For this, data charts and animations using the relevant data were used.
For instance, Bloomberg has a system named Scatteract. With Scatteract, it is possible to read each pixel using the OCR (Optical Character Recognition) technique and convert data points from a particular image to data in tables.
Data visualization is said to be fully understood by algorithms as well in the near future.
Data Visualization With Virtual Reality – Virtualitics
There is nothing better than being able to communicate insights via interactive visuals in real-time. Augmented reality or cue virtual reality technologies are successful and efficient.
According to experts, the market size of augmented virtual reality is expected to be worth about $209 billion by 2022 globally. And the software market size for virtual reality is expected to be worth $6.4 billion by 2021 globally.
An example of virtual reality enhancing the future of Data Visualization is the ‘Project Night At The Museum’. It is a 3D based mobile-friendly observation of virtual reality like a museum that showcases the ‘space’ and so on.
When it comes to Virtual Reality And Augmented Reality, the technology called Virtualitics or even known as ‘Immersive Analytics’ provides visual control to viewers to explore data sets, Artificial Intelligence support or smart mapping support made possible by multi-dimensional data analysis.
Virtualitics provides a 3D collaborative environment which is used to link data with pattern recognition. This is used to retrieve various multi-dimensional relationships. For instance, Scatter Plots are a good example of 3D Visualization provided by Virtualitics. Scatter Plots help in combining different metrics together to form a single and simple graphics.
Related Reading: Find the right difference between data visualization and data analytics.
The Three Big Changes In Data Visualization
As Data Visualization is evolving at the technological forefront, there is a constant increase in the number of analytics tools. One set of analytical tools is the Rapid Prototyping tools and the other being Charting Libraries. The main three changes identified are as follows:
- Disruptive Tools: Disruption in Data Analytics and Visualization
- Application In Many Industry Verticals: Marketing Analytics, HR and Product Analytics, Manufacturing, Healthcare, Education, Finance, IT and so on.
- Cross-pollination of different people to join the field of data science: This is a cross-pollination of ideas from different sectors such as astronomy, arts, science and so on.
Related Reading: Read on to know about 7 amazing data visualization tools.
Data Visualization As An Investment
According to the recent Data Connectivity Outlook Survey by Progress, 59 percent of organizations said that they use Data Visualization techniques and it has profoundly converted into investment.
For instance, medical imaging technologies such as MRI scans, etc., have led to R&D companies that provide medical data visualization solutions.
IoT, AI, and machine learning are continuing to contribute to Data Visualization by being able to draw critical insights derived from these data.
Data Visualization is the easiest way to provide a clear picture to depict any complex data and to retrieve useful insights. To discover how Data Visualization can boost your business efficiency, reach out to our team of experts at Fingent, a leading custom software development company. Contact us now!
Stay up to date on what's new
About the Author
Featured Blogs
Stay up to date on
what's new
Talk To Our Experts
5 Technology Trends Real Estate Players Should Watch Out For
Digital transformation is today the hottest area of interest in almost every business sector. With the huge growth in a digital savvy user base, enterprises big or small are continuously investing in new age digital technologies and tools to help them serve customers better and survive the tough market competition. The real estate sector is no different in this regard as digital technologies have reshaped both the customer and property landscape over the past couple of years. From facilities such as a simple listing of properties online to AI enabled best property matching based on preferences, the list of digital innovations in the real estate sector is huge. If your primary business is centered around real estate, then the following 5 technology innovations should certainly be on your watch list for 2019.
Augmented and Virtual Reality Applications
Today, real estate is a globally accessible commodity and not restrictive to localized demand. A property may attract interest from buyers across the world and not just in the vicinity or city that it is located. The challenge then lies in providing a holistic experience for the interested buyer to have a good look and feel of the property before investing. It may not always be possible to bring them physically to the place due to cost or other travel related concerns. This is where technology such as AR and VR can make a difference. With hardware devices, making AR/VR capabilities, inexpensive and accessible, property managers can easily facilitate an AR/VR demo for buyers to make faster and better decisions from anywhere. Another useful application would be for homeowners to use AR/VR to decide their home décor or construction techniques. For example, the positioning of furniture, temporary or permanent interior fixtures, etc., can be decided way before the actual construction begins. This allows more planning and elimination of cost overheads wherein both buyer and builder would have a clear understanding of how the building is to be constructed.
Check out how AR and VR are revolutionizing the real estate industry.
This video is made using InVideo.io
Big Data Analytics
Real estate is one sector where pricing is a highly dynamic constituent. There are a number of factors influencing property or land prices and very often owners or enterprises that manage properties find it hard to offer competitive or profitable pricing to prospective buyers. However, several forward-thinking players have now started to utilize the power of big data analytics to get the most preferential pricing schemes that bolster both interests from buyers as well as maintain a competitive profit margin for sellers or property owners. Historical rental or property cost data along with trends such as demographic changes, population density, preferential behavior, amenity choices, spending patterns, etc., are supplied as data insights into powerful analytical systems. These in turn offer insights or in other words recommendations for property owners to price their offerings competitively and enhance the overall buying or rental experience for a consumer.
Related Reading: Find how Big Data is influencing the health care industry.
Innovative Property Management
The rise of start-up culture and the global workforce paradigm has impacted the real estate sector considerably. Today, it is not just one major tenant that leases an entire building or space within a building to set up its office, but several players invest to take up co-working spaces. In fact, studies have shown that shared workspaces have grown at an incredible rate of 200% over 5 years from 2013 to 2018. Co-working spaces facilitate companies to set up a presence where their best employees prefer to work thereby helping in boosting retention levels. For the real estate sector, this change in occupancy trend has called for the rise of innovative property management software that incorporates several new technology offerings. For example, power and other utility services have to be shared among multiple tenants in a co-working space and this requires the property management tool to be integrated with an IoT powered building management system that can monitor occupancy levels, adjust power and other environmental support features like lighting, temperature control, etc. Doing these tasks manually would require considerable overhead and hiring of a large workforce. Autonomous IoT integrated property management solutions can easily facilitate multiple tenants to collaborate in a workspace saving them the hassle of worrying about unwanted costs and the owners can have peace of mind without having to deal with manual supply and maintenance of essential support services.
Related Reading: Check out tips to select the right software for property management.
Blockchain Powered Smart Contracts
While some of the technology advancements we mentioned before require autonomous property management, blockchain is the key ingredient that can help make it possible in real time. The decentralized and highly immutable features of blockchain can help transform real estate management and property leasing considerably. An owner or landlord can easily rent out or sell portions of his property with agreed terms and conditions all recorded on smart contracts. The contract makes the details of the sale or rental highly encrypted and complies with all local laws and regulations. Besides, several government agencies are increasingly investing in blockchain to set up regulatory repositories that can autonomously validate land records, property and tax implications and much more. So, if real estate buyers can bump up their investments in blockchain, they can turn to become more compliant and legitimate in the market. This would increase affection for their offerings for prospective customers.
Digital Advertising and Sales
Today, a large portion of prospective buyers or leasing clients are hooked to social media and other digital channels to gain information. As a real estate dealer, you need to ensure that your properties are marketed in the right digital channel and reach the right audience within such channels. There are tons of social media advertising platforms that help you filter your target audience to the finest level. If you do not want to spend time on the filtering part, there are AI-powered tools that help do the job even better than humans. AI is not just limited to ad filtering for the real estate sector. There are intelligent chatbot applications available today for deployment in your website. These bots can converse with potential buyers when they inquire on your website, collect their information, suggest them the best choices based on their preferences, pass the right information to sales agents to take the lead further and ultimately help them close it quickly. From marketing automation to intelligent sales conversations, there is a host of digital solutions that the real estate players, can utilize to win customer hearts with personalization in highly competitive markets.
Related Reading: Watch out for the emerging technology trends of 2019.
No longer can the real estate sector be labeled as a laggard in terms of technology innovations. There are plenty of digital avenues where smart players can invest and stand out from the competition. We have showcased 5 of these avenues that are increasingly driving more value for adopters and we believe that these should be on the watchlist of any real estate player in 2019. Going digital friendly is no easy task, especially if you do not have a sizeable technology team in-house who is well versed in all these innovations. But that is where a technology partner like Fingent can prove to be the decisive factor in on-boarding the best technology innovations in your real estate business. If you are aspiring to be a leader in the real estate space through technology, talk to our experts today to explore the vast opportunities in digital transformation for your business.
Stay up to date on what's new
About the Author

Featured Blogs
Stay up to date on
what's new
Talk To Our Experts
The Healthcare sector is booming at a faster rate and the necessity to manage patient care and innovate medicines has increased synonymously. With the rise in such needs, newer technologies are being adopted in the industry. One such major change that might take place in the future is the use of Big Data and Analytics in the Healthcare sector.
According to an International Data Corporation (IDC) report sponsored by Seagate Technology, it is found that big data is projected to grow faster in healthcare than in sectors like manufacturing, financial services or media. It is estimated that the healthcare data will experience a compound annual growth rate (CAGR) of 36 percent through 2025.
Market research have shown that the global big data in the healthcare market is expected to reach $34.27 billion by 2022 at a CAGR of 22.07%. Globally, the big data analytics segment are expected to be worth more than $68.03 billion by 2024, driven largely by continued North American investments in electronic health records, practice management tools, and workforce management solutions.
Here are 5 ways in which Big Data can help and change the entire scenario of the Healthcare sector.
1. Health Tracking
Big Data and Analytics along with the Internet of Things (IoT), is revolutionizing the way one can track various user statistics and vitals. Apart from the basic wearables that can detect the patient’s sleep, heart rate, exercise, distance walked, etc. there are new medical innovations that can monitor the patient’s blood pressure, pulse Oximeters, glucose monitors, and more. The continuous monitoring of the body vitals along with the sensor data collection will allow healthcare organizations to keep people out of the hospital since they can identify potential health issue and provide care before the situation goes worse.
2. Reducing Cost
Big Data can be a great way to save costs for hospitals that either over or under book staff members. Predictive analysis can help resolve this issue by predicting the admission rates and help with staff allocation. This will reduce the Rate of Investment incurred by hospitals and in fact help utilize their investment to the max. The insurance industry can save money by backing wearables and health trackers to ensure that patients do not spend time in the hospital. It can save wait times for patients since the hospital will have adequate staff and beds available as per the analysis all the time. Predictive analytics also helps cut costs by reducing the rate of hospital readmissions.
According to a recent report by the Society of Actuaries, 47% of healthcare organizations are already using predictive analytics. It is also noted that over 57% of healthcare sectors believe that predictive analytics will save organizations 25 percent or more in annual costs over the next five years.
Healthcare & Big Data Facts: McKinsey & Company report states that after 20 years of steady increases, healthcare expenses now represent 17.6% of GDP, ie. nearly $600 billion more than the expected benchmark for the U.S. size and wealth.
3. Assisting High-Risk Patients
If all the hospital records are digitized, it will be the perfect data that can be accessed to understand the pattern of many patients. It can identify the patients approaching the hospital repeatedly and identify their chronic issues. Such understanding will help in giving such patients better care and provide an insight into corrective measures to reduce their frequent visits. It is a great way to keep a list and check on high-risk patients and offer them customized care.
Read more: Healthcare Technology and Mobile Apps
4. Preventing Human Errors
A lot many times it has been noted that the professionals tend to either prescribe a wrong medicine or dispatch a different medication by mistake. Such errors, in general, can be reduced since Big Data can be leveraged to analyze user data and the prescribed medication. It can corroborate the data and flag potential out of place prescription to reduce mistakes and save lives. Such software can be a great tool for physicians who cater to many patients in a day.
Healthcare & Big Data Facts: The Centers for Medicare and Medicaid Services prevented more than $210.7 million in healthcare fraud in one year using predictive analytics.
5. Advancement in Healthcare Sector
Apart from the current scenario, Big Data can be a great benefit for advancement in science and technology. For Healthcare, Artificial Intelligence, such as IBM’s Watson can be used to surf through numerous data within seconds to find solutions for various diseases. Such advancement is already in progress and will continue to grow with the amount of research collected by Big Data. It will not only be able to provide accurate solutions, but also offer customized solutions for unique problems. The availability of predictive analysis will assist patients traveling to a particular geographical location by studying similar patients in that area.
Healthcare & Big Data Facts: Effective use of big data could add $300 million per year to the healthcare industry.
Thus, to sum up, Big Data increases the ability of the healthcare sectors to:
- Predict Epidemics
- Cure Disease
- Improve Quality of Life
- Increase Preventable Care
- Begin Early Preventive Care
- Spot Warning Signs Sooner
Numerous studies and researches prove that technology has tremendously transformed the healthcare sectors. Professor and researcher Ronda Hughes too explains in her research how big data is improving health services.
Improving health outcomes with big data | Source : TEDxUofSC
Although most part of Big Data generated is not fully utilized currently due to limitations of the toolset and funds, it is definitely the future. Invest in the future and leverage Big Data Analytics to be a part of the evolving Healthcare Industry by partnering with Fingent, a top custom software development company with extensive experience in this domain.
Related Reading: Find out how big companies are using the power of Big Data to enhance customer experience.
Supercharge your field operations with ReachOut
Cloud-based field service platform to optimize service delivery for efficiency and cost savings. Schedule jobs, dispatch technicians, generate tickets, quotes, invoices & more.
Start Now
Stay up to date on what's new
About the Author
Featured Blogs
Stay up to date on
what's new
Talk To Our Experts
With data now being a critical source of competitive advantage, enterprises are cutting across size and geographies seeking newer methods to identify and analyze the data they generate. Most enterprise decision makers are now familiar with intuitive graphs, pie-charts, and other forms of visualizations that try to make sense of sales, revenue, and other aspects of company operations. However, the usefulness of such data visualizations depends on the effectiveness of the data, or how the data is used to come up with conclusions. A balanced approach in data visualization and analytics is thus pivotal in formulating an effective data strategy.
Many enterprises confuse data analytics with data visualization. Both allow users to make sense of data and obtain the relevant metrics that helps in better decision making. In today’s age of information overload, where data generated is multiplying every 3 years, interpreting them turns out to be the need of the hour. On the other side, we have these forecasts and projections hinting at an exponential growth in revenue for the big data software market in the coming years. The confusion, however, stems from the fact that both data visualization and analytics represent data in visual interfaces.
While there is considerable overlap between the two, data analytics deals with data at a much deeper level, compared to visualization. An end-to-end business intelligence solution consists not just of the front end dashboard, which transforms data into a visual context, but also tools and algorithms at the backend.
Related Reading: Find out how enterprises are relying on business intelligence platforms to leverage data for driving innovation and growth.
Difference between Data Visualization and Data Analytics
Data visualization represents data in a visual context by making explicit the trends and patterns inherent in the data. Such pattern and trends may not be explicit in text-based data. Most tools allow the application of filters to manipulate the data as per user requirements. The traditional forms of visualization, in the form of charts, tables, line graphs, column charts, and many other forms, have of late been supplanted by highly insightful 3D visualizations.
Data analytics go a step deeper, identifying or discovering the trends and patterns inherent in the data. Data visualizations, while allowing users to make sense of the data, need not give the complete picture. Visualizations are only as effective as the data used to prepare the visualization in the first place. Feeding visualization engine with incomplete data will render half-baked, obsolete, or erroneous visualization.

Moreover, today’s enterprises gather data from multiple sources, and store data in multiple repositories, including many silos. In such a state of affairs, gathering comprehensive data for visualization is a tough ask. While visualization tools mostly deal with raw and unstructured data, end-to-end analytic tools employ data mining algorithms to cleanse the data, evaluates the cleansed data using different evaluation models and software tools, subject it to algorithms, and then decides how to display the results.
Data Integration as the first step of the process
The essential prerequisite of effective analysis is consolidating all data in one central place for effective analytics. While there are analytical engines capable of collecting data from multiple silos, consolidating data in one place enables a “single version of the truth,” preventing duplicating and contradicting data from distorting the visualizations. Until recently, many companies use to aggregate data manually, on an ad-hoc basis, as it was easier this way than invest time and effort in a solution for the same.
However, the sheer increase in the volume of data in recent times makes manual aggregation impossible. A number of software tools and platforms cater to the need, by providing automated solutions. The add-on benefit of such automated solutions is data cleansing, to eliminate misnamed, outdated, and messy data, inevitable in a set-up which involves disparate sources and users.
Data Analysis as the second step of the process
The logical step after aggregating and cleansing data is subjecting the data to analysis or performing calculations on the data. As today’s business environment has grown complex, data analysis also involves complex calculations. The need for speed introduced multi-stage formulas that perform a number of calculations simultaneously. Visualization tools focus on reporting data rather than analyzing it, and as such, most tools are limited, with restrictions in the possible aggregations per formula.
In contrast, truly end-to-end analytical solutions allow users to create complex formulas, working in separate sources. The software undertakes the required pre-calculations automatically, making life easy for the user. Businesses seeking to thrive in today’s fast-paced business environment need analytic tools which update data and facilitate collaboration in real-time. The leading analytics tool in the market today, such as IBM Cognos play into this need, by streamlining available data and leveraging plug-and-play interfaces to derive colorful dashboards.
Companies in the retail sector have already leveraged the power of data analytics to streamline their business processes and thus maximize revenue. Analytics and visualization have aided them discover patterns and actionable insights pertaining to customer behavior helping managers plan and develop initiatives. Find out how retailers are harnessing data analytics to aggregate their customer data for accentuating efficiency and profitability.
Comprehensive business intelligence analytics suites offer predictive modeling and other types of advanced analytics based on complex algorithms compiled using languages such as R and Python. Advanced data visualization, data warehousing and dashboards make up some of the key technologies used by business intelligence platforms currently. The best solutions offer unmatched flexibility to the user, with the ability to combine data any way the user requires or prefers.
Moreover, the latest analytical platforms apply modern tools such as natural language processing (NLP) and chatbots, making it easier for users to perform the required calculation or input their queries with ease. The latest advances, such as location-based intelligence increases the potential of analytics and actionability of the insights in a big way.
Data Analytics or Visualization: Which comes last?
While the most effective visualization is based on the data subject to analytics, visualization need not always be the end of the process or the culmination of the project. Many situations adopt data analytics and visualization in a cyclical spree.
Consider the case of Zao, who runs a host of machine learning and predictive modeling applications to gauge the success of targeted email campaigns. Data visualization enters early in the process, with the analysts pulling out specific variables into a graph to identify any possible correlation, or to identify metrics such as mean and median averages, data spread and standard deviation metrics, to get a sense of the scope of the data.
Both data visualization and analytics deal with data. Visualization tools generate a beautiful and easy to comprehend report, but only robust backend capability, which handles the messy data and processes the data by applying advanced algorithms, gives an accurate report. Data analytics offers the complete picture, while visualization summarizes the available data in the best possible way. The best solutions co-opt both.
Your data is growing at exponential rates. The insights from data can help the managers and business owners make decisions that can improve turnaround times, efficiency and more.
Related Reading: Get an insight into the hows of using data analytics to scale and grow your business.
Fingent a leading custom software development company, we house a team of skilled business analysts and data visualization experts. With their expertise, we can offer you exceptional data visualization services. Our team can assist you in implementing robust data analytics software that seamlessly integrates data from various sources, providing rich and insightful visual solutions that uncover the true story behind your data. Partner with Fingent today to unlock the power of data visualization and make informed business decisions.
Stay up to date on what's new
About the Author

Featured Blogs
Stay up to date on
what's new


